Note
Click here to download the full example code or to run this example in your browser via Binder
Kernel PCA
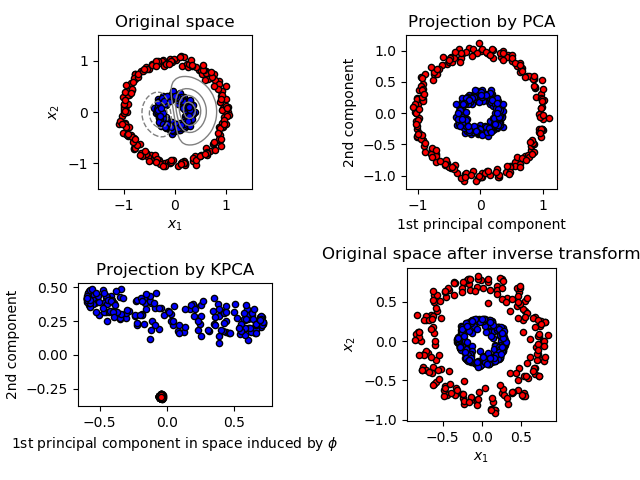
This example shows that Kernel PCA is able to find a projection of the data that makes data linearly separable.

print(__doc__)

# Authors: Mathieu Blondel
#          Andreas Mueller
# License: BSD 3 clause

import numpy as np
import matplotlib.pyplot as plt

from sklearn.decomposition import PCA, KernelPCA
from sklearn.datasets import make_circles

np.random.seed(0)

X, y = make_circles(n_samples=400, factor=.3, noise=.05)

kpca = KernelPCA(kernel="rbf", fit_inverse_transform=True, gamma=10)
X_kpca = kpca.fit_transform(X)
X_back = kpca.inverse_transform(X_kpca)
pca = PCA()
X_pca = pca.fit_transform(X)

# Plot results

plt.figure()
plt.subplot(2, 2, 1, aspect='equal')
plt.title("Original space")
reds = y == 0
blues = y == 1

plt.scatter(X[reds, 0], X[reds, 1], c="red",
            s=20, edgecolor='k')
plt.scatter(X[blues, 0], X[blues, 1], c="blue",
            s=20, edgecolor='k')
plt.xlabel("$x_1$")
plt.ylabel("$x_2$")

X1, X2 = np.meshgrid(np.linspace(-1.5, 1.5, 50), np.linspace(-1.5, 1.5, 50))
X_grid = np.array([np.ravel(X1), np.ravel(X2)]).T
# projection on the first principal component (in the phi space)
Z_grid = kpca.transform(X_grid)[:, 0].reshape(X1.shape)
plt.contour(X1, X2, Z_grid, colors='grey', linewidths=1, origin='lower')

plt.subplot(2, 2, 2, aspect='equal')
plt.scatter(X_pca[reds, 0], X_pca[reds, 1], c="red",
            s=20, edgecolor='k')
plt.scatter(X_pca[blues, 0], X_pca[blues, 1], c="blue",
            s=20, edgecolor='k')
plt.title("Projection by PCA")
plt.xlabel("1st principal component")
plt.ylabel("2nd component")

plt.subplot(2, 2, 3, aspect='equal')
plt.scatter(X_kpca[reds, 0], X_kpca[reds, 1], c="red",
            s=20, edgecolor='k')
plt.scatter(X_kpca[blues, 0], X_kpca[blues, 1], c="blue",
            s=20, edgecolor='k')
plt.title("Projection by KPCA")
plt.xlabel(r"1st principal component in space induced by $\phi$")
plt.ylabel("2nd component")

plt.subplot(2, 2, 4, aspect='equal')
plt.scatter(X_back[reds, 0], X_back[reds, 1], c="red",
            s=20, edgecolor='k')
plt.scatter(X_back[blues, 0], X_back[blues, 1], c="blue",
            s=20, edgecolor='k')
plt.title("Original space after inverse transform")
plt.xlabel("$x_1$")
plt.ylabel("$x_2$")

plt.tight_layout()
plt.show()
Total running time of the script: ( 0 minutes 0.474 seconds)
Estimated memory usage: 8 MB
