sklearn.datasets.fetch_species_distributions
-
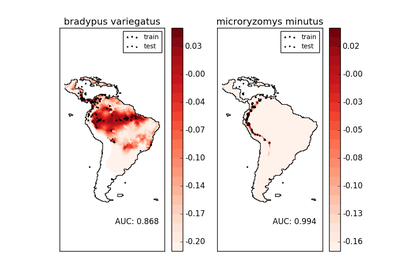
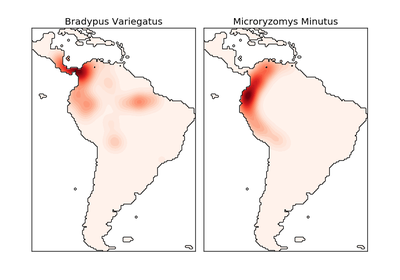
sklearn.datasets.fetch_species_distributions(data_home=None, download_if_missing=True)[source]¶ Loader for species distribution dataset from Phillips et. al. (2006)
Read more in the User Guide.
Parameters: data_home : optional, default: None
Specify another download and cache folder for the datasets. By default all scikit learn data is stored in ‘~/scikit_learn_data’ subfolders.
download_if_missing : optional, True by default
If False, raise a IOError if the data is not locally available instead of trying to download the data from the source site.
Returns: The data is returned as a Bunch object with the following attributes: :
coverages : array, shape = [14, 1592, 1212]
These represent the 14 features measured at each point of the map grid. The latitude/longitude values for the grid are discussed below. Missing data is represented by the value -9999.
train : record array, shape = (1623,)
The training points for the data. Each point has three fields:
- train[‘species’] is the species name
- train[‘dd long’] is the longitude, in degrees
- train[‘dd lat’] is the latitude, in degrees
test : record array, shape = (619,)
The test points for the data. Same format as the training data.
Nx, Ny : integers
The number of longitudes (x) and latitudes (y) in the grid
x_left_lower_corner, y_left_lower_corner : floats
The (x,y) position of the lower-left corner, in degrees
grid_size : float
The spacing between points of the grid, in degrees
Notes
- See examples/applications/plot_species_distribution_modeling.py for an example of using this dataset with scikit-learn
References
- “Maximum entropy modeling of species geographic distributions” S. J. Phillips, R. P. Anderson, R. E. Schapire - Ecological Modelling, 190:231-259, 2006.