
Plot randomly generated multilabel dataset
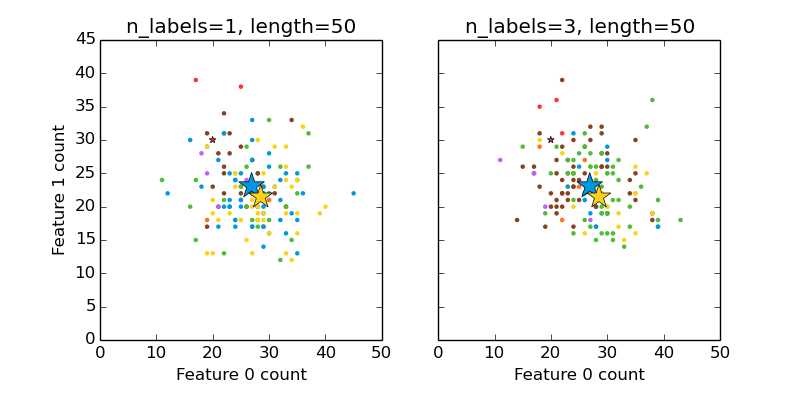
This illustrates the datasets.make_multilabel_classification dataset generator. Each sample consists of counts of two features (up to 50 in total), which are differently distributed in each of two classes.
Points are labeled as follows, where Y means the class is present:
1 2 3 Color Y N N Red N Y N Blue N N Y Yellow Y Y N Purple Y N Y Orange Y Y N Green Y Y Y Brown
A star marks the expected sample for each class; its size reflects the probability of selecting that class label.
The left and right examples highlight the n_labels parameter: more of the samples in the right plot have 2 or 3 labels.
Note that this two-dimensional example is very degenerate: generally the number of features would be much greater than the “document length”, while here we have much larger documents than vocabulary. Similarly, with n_classes > n_features, it is much less likely that a feature distinguishes a particular class.
Script output:
The data was generated from (random_state=229):
Class   P(C)    P(w0|C) P(w1|C)
red     0.06    0.40    0.60
blue    0.49    0.54    0.46
yellow  0.45    0.57    0.43
Python source code: plot_random_multilabel_dataset.py
from __future__ import print_function
import numpy as np
import matplotlib.pyplot as plt

from sklearn.datasets import make_multilabel_classification as make_ml_clf

print(__doc__)

COLORS = np.array(['!',
                   '#FF3333',  # red
                   '#0198E1',  # blue
                   '#BF5FFF',  # purple
                   '#FCD116',  # yellow
                   '#FF7216',  # orange
                   '#4DBD33',  # green
                   '#87421F'   # brown
                   ])

# Use same random seed for multiple calls to make_multilabel_classification to
# ensure same distributions
RANDOM_SEED = np.random.randint(2 ** 10)


def plot_2d(ax, n_labels=1, n_classes=3, length=50):
    X, Y, p_c, p_w_c = make_ml_clf(n_samples=150, n_features=2,
                                   n_classes=n_classes, n_labels=n_labels,
                                   length=length, allow_unlabeled=False,
                                   return_indicator=True,
                                   return_distributions=True,
                                   random_state=RANDOM_SEED)

    ax.scatter(X[:, 0], X[:, 1], color=COLORS.take((Y * [1, 2, 4]
                                                    ).sum(axis=1)),
               marker='.')
    ax.scatter(p_w_c[0] * length, p_w_c[1] * length,
               marker='*', linewidth=.5, edgecolor='black',
               s=20 + 1500 * p_c ** 2,
               color=COLORS.take([1, 2, 4]))
    ax.set_xlabel('Feature 0 count')
    return p_c, p_w_c


_, (ax1, ax2) = plt.subplots(1, 2, sharex='row', sharey='row', figsize=(8, 4))
plt.subplots_adjust(bottom=.15)

p_c, p_w_c = plot_2d(ax1, n_labels=1)
ax1.set_title('n_labels=1, length=50')
ax1.set_ylabel('Feature 1 count')

plot_2d(ax2, n_labels=3)
ax2.set_title('n_labels=3, length=50')
ax2.set_xlim(left=0, auto=True)
ax2.set_ylim(bottom=0, auto=True)

plt.show()

print('The data was generated from (random_state=%d):' % RANDOM_SEED)
print('Class', 'P(C)', 'P(w0|C)', 'P(w1|C)', sep='\t')
for k, p, p_w in zip(['red', 'blue', 'yellow'], p_c, p_w_c.T):
    print('%s\t%0.2f\t%0.2f\t%0.2f' % (k, p, p_w[0], p_w[1]))
Total running time of the example: 0.18 seconds ( 0 minutes 0.18 seconds)