Note
Go to the end to download the full example code or to run this example in your browser via JupyterLite or Binder
Balance model complexity and cross-validated score
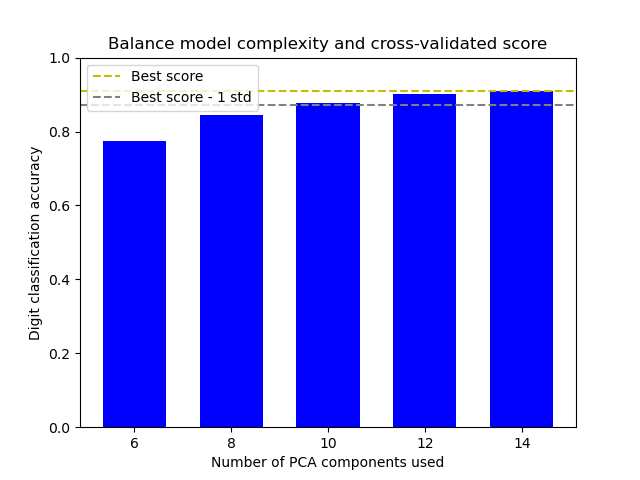
This example balances model complexity and cross-validated score by finding a decent accuracy within 1 standard deviation of the best accuracy score while minimising the number of PCA components [1].
The figure shows the trade-off between cross-validated score and the number of PCA components. The balanced case is when n_components=10 and accuracy=0.88, which falls into the range within 1 standard deviation of the best accuracy score.
[1] Hastie, T., Tibshirani, R.,, Friedman, J. (2001). Model Assessment and Selection. The Elements of Statistical Learning (pp. 219-260). New York, NY, USA: Springer New York Inc..

The best_index_ is 2
The n_components selected is 10
The corresponding accuracy score is 0.88
# Author: Wenhao Zhang <wenhaoz@ucla.edu>

import matplotlib.pyplot as plt
import numpy as np

from sklearn.datasets import load_digits
from sklearn.decomposition import PCA
from sklearn.model_selection import GridSearchCV
from sklearn.pipeline import Pipeline
from sklearn.svm import LinearSVC


def lower_bound(cv_results):
    """
    Calculate the lower bound within 1 standard deviation
    of the best `mean_test_scores`.

    Parameters
    ----------
    cv_results : dict of numpy(masked) ndarrays
        See attribute cv_results_ of `GridSearchCV`

    Returns
    -------
    float
        Lower bound within 1 standard deviation of the
        best `mean_test_score`.
    """
    best_score_idx = np.argmax(cv_results["mean_test_score"])

    return (
        cv_results["mean_test_score"][best_score_idx]
        - cv_results["std_test_score"][best_score_idx]
    )


def best_low_complexity(cv_results):
    """
    Balance model complexity with cross-validated score.

    Parameters
    ----------
    cv_results : dict of numpy(masked) ndarrays
        See attribute cv_results_ of `GridSearchCV`.

    Return
    ------
    int
        Index of a model that has the fewest PCA components
        while has its test score within 1 standard deviation of the best
        `mean_test_score`.
    """
    threshold = lower_bound(cv_results)
    candidate_idx = np.flatnonzero(cv_results["mean_test_score"] >= threshold)
    best_idx = candidate_idx[
        cv_results["param_reduce_dim__n_components"][candidate_idx].argmin()
    ]
    return best_idx


pipe = Pipeline(
    [
        ("reduce_dim", PCA(random_state=42)),
        ("classify", LinearSVC(random_state=42, C=0.01, dual="auto")),
    ]
)

param_grid = {"reduce_dim__n_components": [6, 8, 10, 12, 14]}

grid = GridSearchCV(
    pipe,
    cv=10,
    n_jobs=1,
    param_grid=param_grid,
    scoring="accuracy",
    refit=best_low_complexity,
)
X, y = load_digits(return_X_y=True)
grid.fit(X, y)

n_components = grid.cv_results_["param_reduce_dim__n_components"]
test_scores = grid.cv_results_["mean_test_score"]

plt.figure()
plt.bar(n_components, test_scores, width=1.3, color="b")

lower = lower_bound(grid.cv_results_)
plt.axhline(np.max(test_scores), linestyle="--", color="y", label="Best score")
plt.axhline(lower, linestyle="--", color=".5", label="Best score - 1 std")

plt.title("Balance model complexity and cross-validated score")
plt.xlabel("Number of PCA components used")
plt.ylabel("Digit classification accuracy")
plt.xticks(n_components.tolist())
plt.ylim((0, 1.0))
plt.legend(loc="upper left")

best_index_ = grid.best_index_

print("The best_index_ is %d" % best_index_)
print("The n_components selected is %d" % n_components[best_index_])
print(
    "The corresponding accuracy score is %.2f"
    % grid.cv_results_["mean_test_score"][best_index_]
)
plt.show()
Total running time of the script: (0 minutes 1.261 seconds)
Related examples

Custom refit strategy of a grid search with cross-validation

Comparing Random Forests and Histogram Gradient Boosting models

Recursive feature elimination with cross-validation

Sample pipeline for text feature extraction and evaluation

Pipelining: chaining a PCA and a logistic regression