Note
Go to the end to download the full example code or to run this example in your browser via JupyterLite or Binder
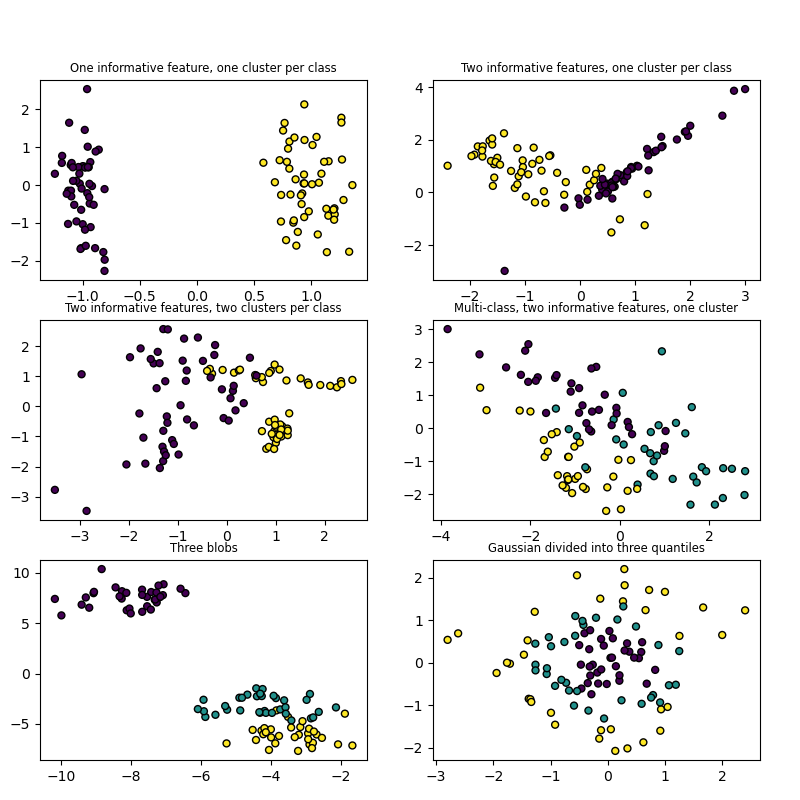
Plot randomly generated classification dataset
This example plots several randomly generated classification datasets. For easy visualization, all datasets have 2 features, plotted on the x and y axis. The color of each point represents its class label.
The first 4 plots use the make_classification with
different numbers of informative features, clusters per class and classes.
The final 2 plots use make_blobs and
make_gaussian_quantiles.
import matplotlib.pyplot as plt

from sklearn.datasets import make_blobs, make_classification, make_gaussian_quantiles

plt.figure(figsize=(8, 8))
plt.subplots_adjust(bottom=0.05, top=0.9, left=0.05, right=0.95)

plt.subplot(321)
plt.title("One informative feature, one cluster per class", fontsize="small")
X1, Y1 = make_classification(
    n_features=2, n_redundant=0, n_informative=1, n_clusters_per_class=1
)
plt.scatter(X1[:, 0], X1[:, 1], marker="o", c=Y1, s=25, edgecolor="k")

plt.subplot(322)
plt.title("Two informative features, one cluster per class", fontsize="small")
X1, Y1 = make_classification(
    n_features=2, n_redundant=0, n_informative=2, n_clusters_per_class=1
)
plt.scatter(X1[:, 0], X1[:, 1], marker="o", c=Y1, s=25, edgecolor="k")

plt.subplot(323)
plt.title("Two informative features, two clusters per class", fontsize="small")
X2, Y2 = make_classification(n_features=2, n_redundant=0, n_informative=2)
plt.scatter(X2[:, 0], X2[:, 1], marker="o", c=Y2, s=25, edgecolor="k")

plt.subplot(324)
plt.title("Multi-class, two informative features, one cluster", fontsize="small")
X1, Y1 = make_classification(
    n_features=2, n_redundant=0, n_informative=2, n_clusters_per_class=1, n_classes=3
)
plt.scatter(X1[:, 0], X1[:, 1], marker="o", c=Y1, s=25, edgecolor="k")

plt.subplot(325)
plt.title("Three blobs", fontsize="small")
X1, Y1 = make_blobs(n_features=2, centers=3)
plt.scatter(X1[:, 0], X1[:, 1], marker="o", c=Y1, s=25, edgecolor="k")

plt.subplot(326)
plt.title("Gaussian divided into three quantiles", fontsize="small")
X1, Y1 = make_gaussian_quantiles(n_features=2, n_classes=3)
plt.scatter(X1[:, 0], X1[:, 1], marker="o", c=Y1, s=25, edgecolor="k")

plt.show()
Total running time of the script: (0 minutes 0.313 seconds)
Related examples
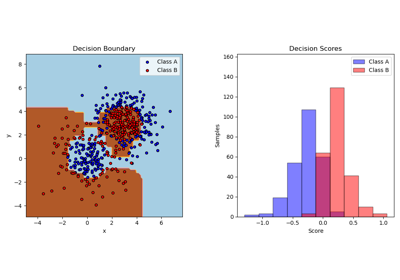
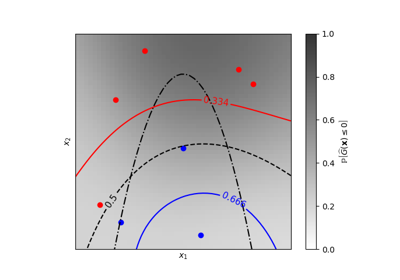
Iso-probability lines for Gaussian Processes classification (GPC)
Iso-probability lines for Gaussian Processes classification (GPC)
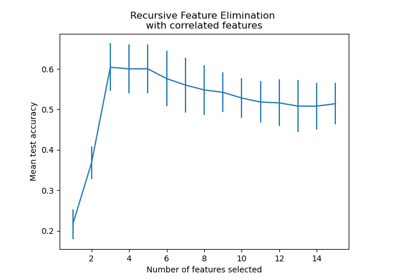
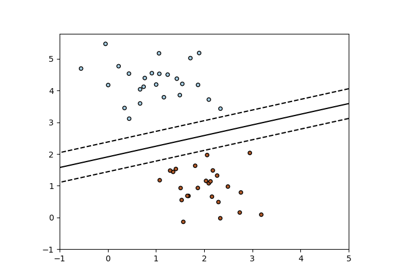
Recursive feature elimination with cross-validation
Recursive feature elimination with cross-validation