Note
Go to the end to download the full example code or to run this example in your browser via JupyterLite or Binder
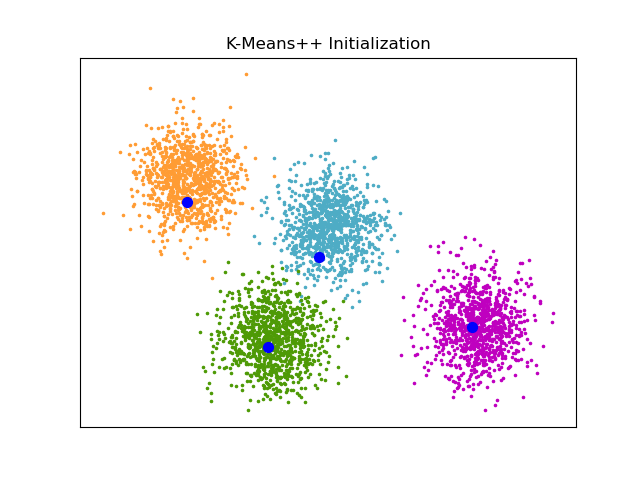
An example of K-Means++ initialization
An example to show the output of the sklearn.cluster.kmeans_plusplus
function for generating initial seeds for clustering.
K-Means++ is used as the default initialization for K-means.
import matplotlib.pyplot as plt

from sklearn.cluster import kmeans_plusplus
from sklearn.datasets import make_blobs

# Generate sample data
n_samples = 4000
n_components = 4

X, y_true = make_blobs(
    n_samples=n_samples, centers=n_components, cluster_std=0.60, random_state=0
)
X = X[:, ::-1]

# Calculate seeds from k-means++
centers_init, indices = kmeans_plusplus(X, n_clusters=4, random_state=0)

# Plot init seeds along side sample data
plt.figure(1)
colors = ["#4EACC5", "#FF9C34", "#4E9A06", "m"]

for k, col in enumerate(colors):
    cluster_data = y_true == k
    plt.scatter(X[cluster_data, 0], X[cluster_data, 1], c=col, marker=".", s=10)

plt.scatter(centers_init[:, 0], centers_init[:, 1], c="b", s=50)
plt.title("K-Means++ Initialization")
plt.xticks([])
plt.yticks([])
plt.show()
Total running time of the script: (0 minutes 0.061 seconds)
Related examples
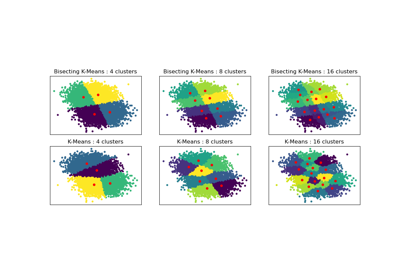
Bisecting K-Means and Regular K-Means Performance Comparison
Bisecting K-Means and Regular K-Means Performance Comparison
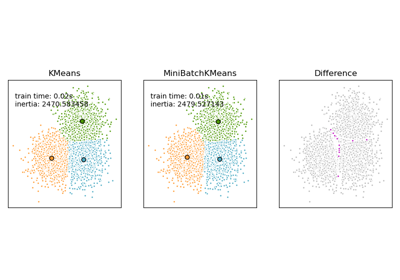
Comparison of the K-Means and MiniBatchKMeans clustering algorithms
Comparison of the K-Means and MiniBatchKMeans clustering algorithms
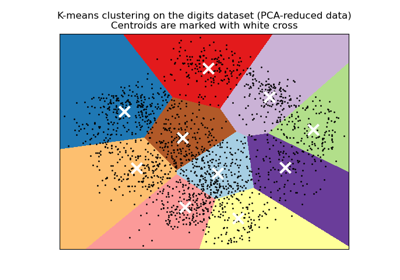
A demo of K-Means clustering on the handwritten digits data
A demo of K-Means clustering on the handwritten digits data
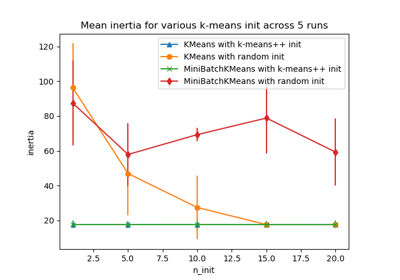
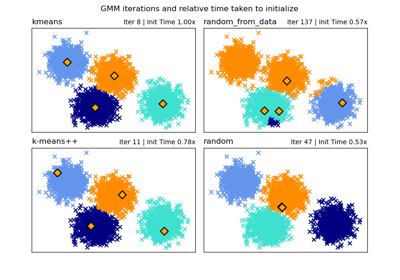
Empirical evaluation of the impact of k-means initialization
Empirical evaluation of the impact of k-means initialization