sklearn.datasets.make_blobs
- sklearn.datasets.make_blobs(n_samples=100, n_features=2, *, centers=None, cluster_std=1.0, center_box=(-10.0, 10.0), shuffle=True, random_state=None, return_centers=False)[source]
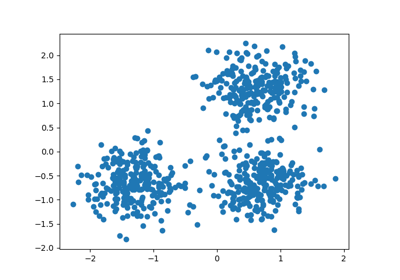
Generate isotropic Gaussian blobs for clustering.
Read more in the User Guide.
- Parameters:
- n_samplesint or array-like, default=100
If int, it is the total number of points equally divided among clusters. If array-like, each element of the sequence indicates the number of samples per cluster.
Changed in version v0.20: one can now pass an array-like to the
n_samplesparameter- n_featuresint, default=2
The number of features for each sample.
- centersint or ndarray of shape (n_centers, n_features), default=None
The number of centers to generate, or the fixed center locations. If n_samples is an int and centers is None, 3 centers are generated. If n_samples is array-like, centers must be either None or an array of length equal to the length of n_samples.
- cluster_stdfloat or array-like of float, default=1.0
The standard deviation of the clusters.
- center_boxtuple of float (min, max), default=(-10.0, 10.0)
The bounding box for each cluster center when centers are generated at random.
- shufflebool, default=True
Shuffle the samples.
- random_stateint, RandomState instance or None, default=None
Determines random number generation for dataset creation. Pass an int for reproducible output across multiple function calls. See Glossary.
- return_centersbool, default=False
If True, then return the centers of each cluster.
New in version 0.23.
- Returns:
- Xndarray of shape (n_samples, n_features)
The generated samples.
- yndarray of shape (n_samples,)
The integer labels for cluster membership of each sample.
- centersndarray of shape (n_centers, n_features)
The centers of each cluster. Only returned if
return_centers=True.
See also
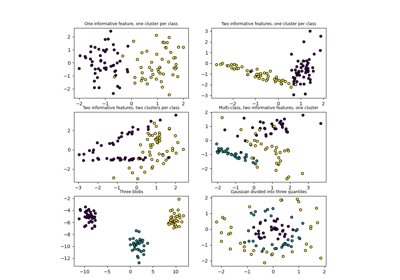
make_classificationA more intricate variant.
Examples
>>> from sklearn.datasets import make_blobs
>>> X, y = make_blobs(n_samples=10, centers=3, n_features=2,
...                   random_state=0)
>>> print(X.shape)
(10, 2)
>>> y
array([0, 0, 1, 0, 2, 2, 2, 1, 1, 0])
>>> X, y = make_blobs(n_samples=[3, 3, 4], centers=None, n_features=2,
...                   random_state=0)
>>> print(X.shape)
(10, 2)
>>> y
array([0, 1, 2, 0, 2, 2, 2, 1, 1, 0])
Examples using sklearn.datasets.make_blobs
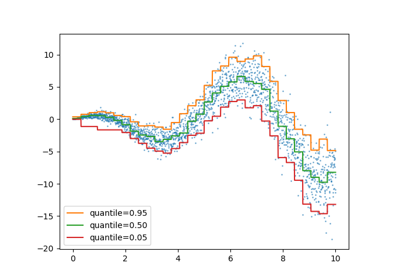
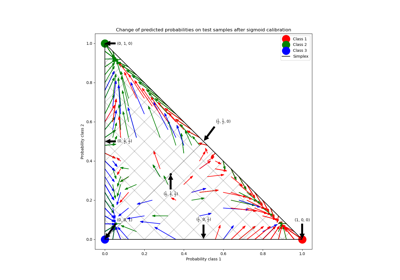
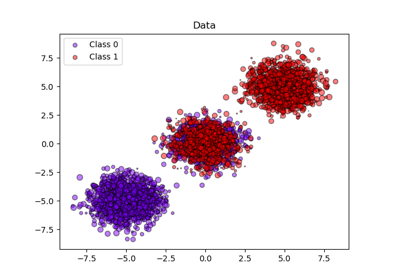
Probability Calibration for 3-class classification
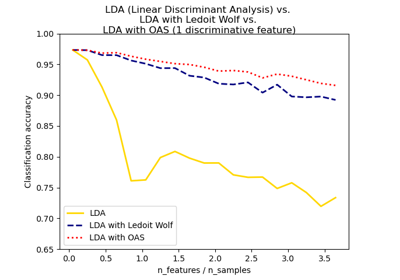
Normal, Ledoit-Wolf and OAS Linear Discriminant Analysis for classification
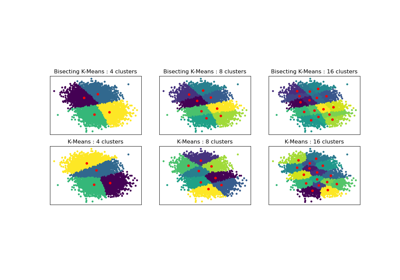
Bisecting K-Means and Regular K-Means Performance Comparison
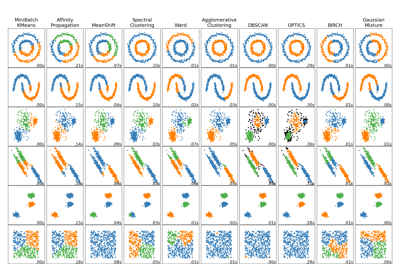
Comparing different clustering algorithms on toy datasets
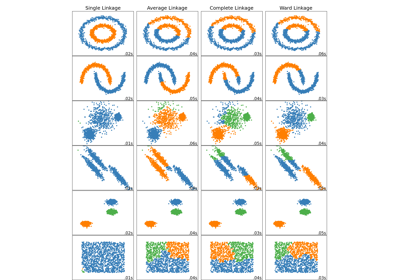
Comparing different hierarchical linkage methods on toy datasets
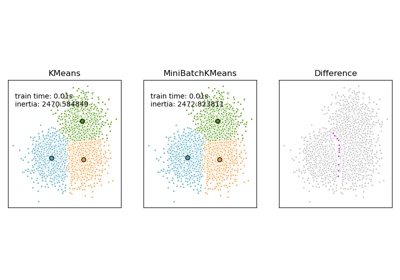
Comparison of the K-Means and MiniBatchKMeans clustering algorithms
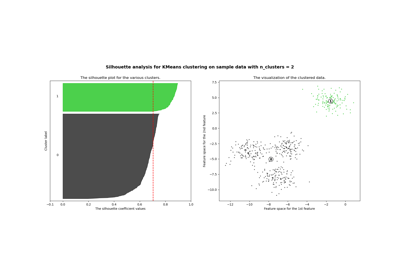
Selecting the number of clusters with silhouette analysis on KMeans clustering
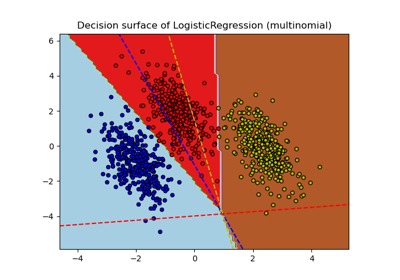
Plot multinomial and One-vs-Rest Logistic Regression
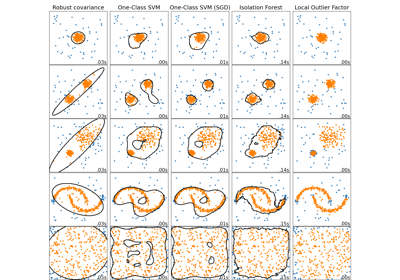
Comparing anomaly detection algorithms for outlier detection on toy datasets
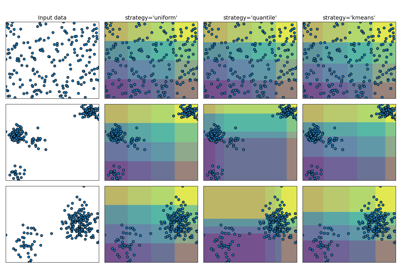
Demonstrating the different strategies of KBinsDiscretizer