sklearn.inspection.partial_dependence
- sklearn.inspection.partial_dependence(estimator, X, features, *, response_method='auto', percentiles=(0.05, 0.95), grid_resolution=100, method='auto', kind='average')[source]
Partial dependence of
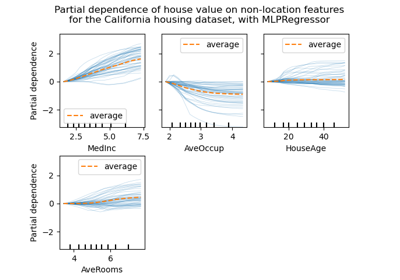
features.Partial dependence of a feature (or a set of features) corresponds to the average response of an estimator for each possible value of the feature.
Read more in the User Guide.
Warning
For
GradientBoostingClassifierandGradientBoostingRegressor, the'recursion'method (used by default) will not account for theinitpredictor of the boosting process. In practice, this will produce the same values as'brute'up to a constant offset in the target response, provided thatinitis a constant estimator (which is the default). However, ifinitis not a constant estimator, the partial dependence values are incorrect for'recursion'because the offset will be sample-dependent. It is preferable to use the'brute'method. Note that this only applies toGradientBoostingClassifierandGradientBoostingRegressor, not toHistGradientBoostingClassifierandHistGradientBoostingRegressor.- Parameters:
- estimatorBaseEstimator
A fitted estimator object implementing predict, predict_proba, or decision_function. Multioutput-multiclass classifiers are not supported.
- X{array-like or dataframe} of shape (n_samples, n_features)
Xis used to generate a grid of values for the targetfeatures(where the partial dependence will be evaluated), and also to generate values for the complement features when themethodis ‘brute’.- featuresarray-like of {int, str}
The feature (e.g.
[0]) or pair of interacting features (e.g.[(0, 1)]) for which the partial dependency should be computed.- response_method{‘auto’, ‘predict_proba’, ‘decision_function’}, default=’auto’
Specifies whether to use predict_proba or decision_function as the target response. For regressors this parameter is ignored and the response is always the output of predict. By default, predict_proba is tried first and we revert to decision_function if it doesn’t exist. If
methodis ‘recursion’, the response is always the output of decision_function.- percentilestuple of float, default=(0.05, 0.95)
The lower and upper percentile used to create the extreme values for the grid. Must be in [0, 1].
- grid_resolutionint, default=100
The number of equally spaced points on the grid, for each target feature.
- method{‘auto’, ‘recursion’, ‘brute’}, default=’auto’
The method used to calculate the averaged predictions:
'recursion'is only supported for some tree-based estimators (namelyGradientBoostingClassifier,GradientBoostingRegressor,HistGradientBoostingClassifier,HistGradientBoostingRegressor,DecisionTreeRegressor,RandomForestRegressor, ) whenkind='average'. This is more efficient in terms of speed. With this method, the target response of a classifier is always the decision function, not the predicted probabilities. Since the'recursion'method implicitly computes the average of the Individual Conditional Expectation (ICE) by design, it is not compatible with ICE and thuskindmust be'average'.'brute'is supported for any estimator, but is more computationally intensive.'auto': the'recursion'is used for estimators that support it, and'brute'is used otherwise.
Please see this note for differences between the
'brute'and'recursion'method.- kind{‘average’, ‘individual’, ‘both’}, default=’average’
Whether to return the partial dependence averaged across all the samples in the dataset or one line per sample or both. See Returns below.
Note that the fast
method='recursion'option is only available forkind='average'. Plotting individual dependencies requires using the slowermethod='brute'option.New in version 0.24.
- Returns:
- predictions
Bunch Dictionary-like object, with the following attributes.
- individualndarray of shape (n_outputs, n_instances, len(values[0]), len(values[1]), …)
The predictions for all the points in the grid for all samples in X. This is also known as Individual Conditional Expectation (ICE)
- averagendarray of shape (n_outputs, len(values[0]), len(values[1]), …)
The predictions for all the points in the grid, averaged over all samples in X (or over the training data if
methodis ‘recursion’). Only available whenkind='both'.- valuesseq of 1d ndarrays
The values with which the grid has been created. The generated grid is a cartesian product of the arrays in
values.len(values) == len(features). The size of each arrayvalues[j]is eithergrid_resolution, or the number of unique values inX[:, j], whichever is smaller.
n_outputscorresponds to the number of classes in a multi-class setting, or to the number of tasks for multi-output regression. For classical regression and binary classificationn_outputs==1.n_values_feature_jcorresponds to the sizevalues[j].
- predictions
See also
PartialDependenceDisplay.from_estimatorPlot Partial Dependence.
PartialDependenceDisplayPartial Dependence visualization.
Examples
>>> X = [[0, 0, 2], [1, 0, 0]]
>>> y = [0, 1]
>>> from sklearn.ensemble import GradientBoostingClassifier
>>> gb = GradientBoostingClassifier(random_state=0).fit(X, y)
>>> partial_dependence(gb, features=[0], X=X, percentiles=(0, 1),
...                    grid_resolution=2)
(array([[-4.52...,  4.52...]]), [array([ 0.,  1.])])
Examples using sklearn.inspection.partial_dependence

Partial Dependence and Individual Conditional Expectation Plots
