Note
Click here to download the full example code or to run this example in your browser via Binder
Gaussian processes on discrete data structures
This example illustrates the use of Gaussian processes for regression and classification tasks on data that are not in fixed-length feature vector form. This is achieved through the use of kernel functions that operates directly on discrete structures such as variable-length sequences, trees, and graphs.
Specifically, here the input variables are some gene sequences stored as variable-length strings consisting of letters ‘A’, ‘T’, ‘C’, and ‘G’, while the output variables are floating point numbers and True/False labels in the regression and classification tasks, respectively.
A kernel between the gene sequences is defined using R-convolution [1] by integrating a binary letter-wise kernel over all pairs of letters among a pair of strings.
This example will generate three figures.
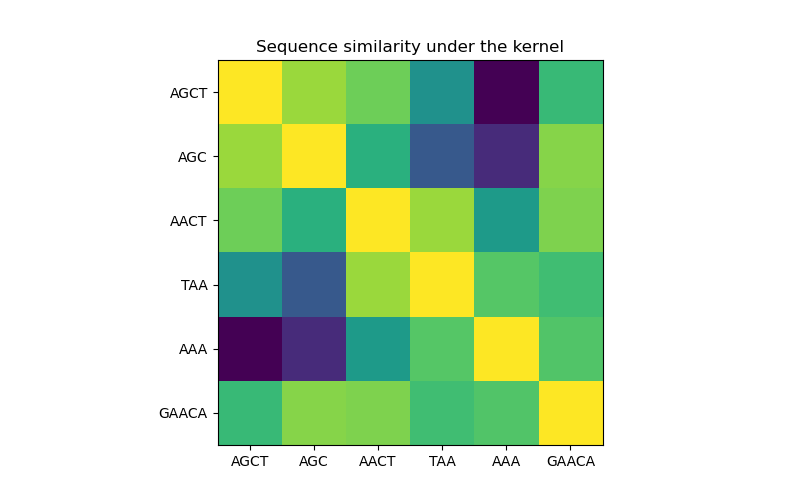
In the first figure, we visualize the value of the kernel, i.e. the similarity of the sequences, using a colormap. Brighter color here indicates higher similarity.
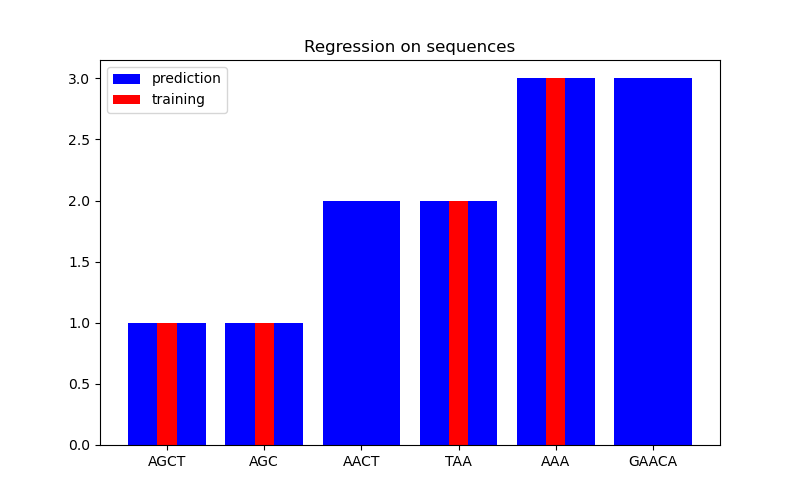
In the second figure, we show some regression result on a dataset of 6 sequences. Here we use the 1st, 2nd, 4th, and 5th sequences as the training set to make predictions on the 3rd and 6th sequences.
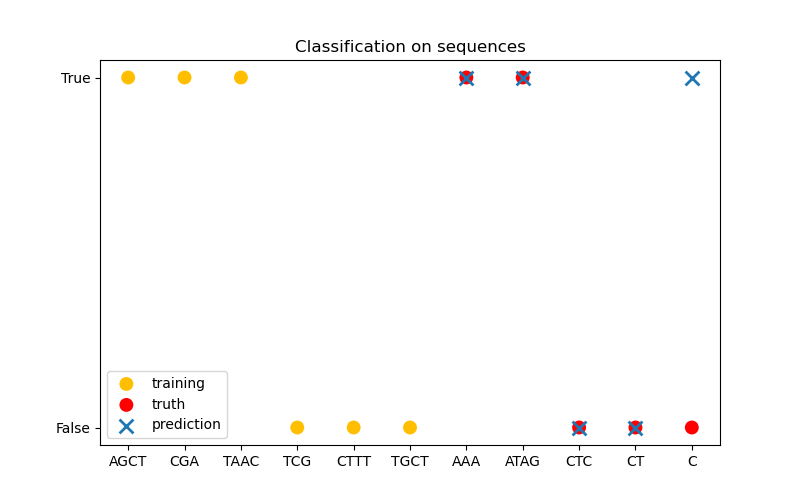
In the third figure, we demonstrate a classification model by training on 6 sequences and make predictions on another 5 sequences. The ground truth here is simply whether there is at least one ‘A’ in the sequence. Here the model makes four correct classifications and fails on one.
/home/runner/work/scikit-learn/scikit-learn/sklearn/gaussian_process/kernels.py:420: ConvergenceWarning: The optimal value found for dimension 0 of parameter baseline_similarity is close to the specified lower bound 1e-05. Decreasing the bound and calling fit again may find a better value.
  warnings.warn(
/home/runner/work/scikit-learn/scikit-learn/examples/gaussian_process/plot_gpr_on_structured_data.py:174: UserWarning: You passed a edgecolor/edgecolors ((0, 1.0, 0.3)) for an unfilled marker ('x').  Matplotlib is ignoring the edgecolor in favor of the facecolor.  This behavior may change in the future.
  plt.scatter(
import numpy as np
import matplotlib.pyplot as plt
from sklearn.gaussian_process.kernels import Kernel, Hyperparameter
from sklearn.gaussian_process.kernels import GenericKernelMixin
from sklearn.gaussian_process import GaussianProcessRegressor
from sklearn.gaussian_process import GaussianProcessClassifier
from sklearn.base import clone


class SequenceKernel(GenericKernelMixin, Kernel):
    """
    A minimal (but valid) convolutional kernel for sequences of variable
    lengths."""

    def __init__(self, baseline_similarity=0.5, baseline_similarity_bounds=(1e-5, 1)):
        self.baseline_similarity = baseline_similarity
        self.baseline_similarity_bounds = baseline_similarity_bounds

    @property
    def hyperparameter_baseline_similarity(self):
        return Hyperparameter(
            "baseline_similarity", "numeric", self.baseline_similarity_bounds
        )

    def _f(self, s1, s2):
        """
        kernel value between a pair of sequences
        """
        return sum(
            [1.0 if c1 == c2 else self.baseline_similarity for c1 in s1 for c2 in s2]
        )

    def _g(self, s1, s2):
        """
        kernel derivative between a pair of sequences
        """
        return sum([0.0 if c1 == c2 else 1.0 for c1 in s1 for c2 in s2])

    def __call__(self, X, Y=None, eval_gradient=False):
        if Y is None:
            Y = X

        if eval_gradient:
            return (
                np.array([[self._f(x, y) for y in Y] for x in X]),
                np.array([[[self._g(x, y)] for y in Y] for x in X]),
            )
        else:
            return np.array([[self._f(x, y) for y in Y] for x in X])

    def diag(self, X):
        return np.array([self._f(x, x) for x in X])

    def is_stationary(self):
        return False

    def clone_with_theta(self, theta):
        cloned = clone(self)
        cloned.theta = theta
        return cloned


kernel = SequenceKernel()

"""
Sequence similarity matrix under the kernel
===========================================
"""

X = np.array(["AGCT", "AGC", "AACT", "TAA", "AAA", "GAACA"])

K = kernel(X)
D = kernel.diag(X)

plt.figure(figsize=(8, 5))
plt.imshow(np.diag(D**-0.5).dot(K).dot(np.diag(D**-0.5)))
plt.xticks(np.arange(len(X)), X)
plt.yticks(np.arange(len(X)), X)
plt.title("Sequence similarity under the kernel")

"""
Regression
==========
"""

X = np.array(["AGCT", "AGC", "AACT", "TAA", "AAA", "GAACA"])
Y = np.array([1.0, 1.0, 2.0, 2.0, 3.0, 3.0])

training_idx = [0, 1, 3, 4]
gp = GaussianProcessRegressor(kernel=kernel)
gp.fit(X[training_idx], Y[training_idx])

plt.figure(figsize=(8, 5))
plt.bar(np.arange(len(X)), gp.predict(X), color="b", label="prediction")
plt.bar(training_idx, Y[training_idx], width=0.2, color="r", alpha=1, label="training")
plt.xticks(np.arange(len(X)), X)
plt.title("Regression on sequences")
plt.legend()

"""
Classification
==============
"""

X_train = np.array(["AGCT", "CGA", "TAAC", "TCG", "CTTT", "TGCT"])
# whether there are 'A's in the sequence
Y_train = np.array([True, True, True, False, False, False])

gp = GaussianProcessClassifier(kernel)
gp.fit(X_train, Y_train)

X_test = ["AAA", "ATAG", "CTC", "CT", "C"]
Y_test = [True, True, False, False, False]

plt.figure(figsize=(8, 5))
plt.scatter(
    np.arange(len(X_train)),
    [1.0 if c else -1.0 for c in Y_train],
    s=100,
    marker="o",
    edgecolor="none",
    facecolor=(1, 0.75, 0),
    label="training",
)
plt.scatter(
    len(X_train) + np.arange(len(X_test)),
    [1.0 if c else -1.0 for c in Y_test],
    s=100,
    marker="o",
    edgecolor="none",
    facecolor="r",
    label="truth",
)
plt.scatter(
    len(X_train) + np.arange(len(X_test)),
    [1.0 if c else -1.0 for c in gp.predict(X_test)],
    s=100,
    marker="x",
    edgecolor=(0, 1.0, 0.3),
    linewidth=2,
    label="prediction",
)
plt.xticks(np.arange(len(X_train) + len(X_test)), np.concatenate((X_train, X_test)))
plt.yticks([-1, 1], [False, True])
plt.title("Classification on sequences")
plt.legend()

plt.show()
Total running time of the script: ( 0 minutes 0.190 seconds)