sklearn.metrics.PrecisionRecallDisplay
- class sklearn.metrics.PrecisionRecallDisplay(precision, recall, *, average_precision=None, estimator_name=None, pos_label=None)[source]
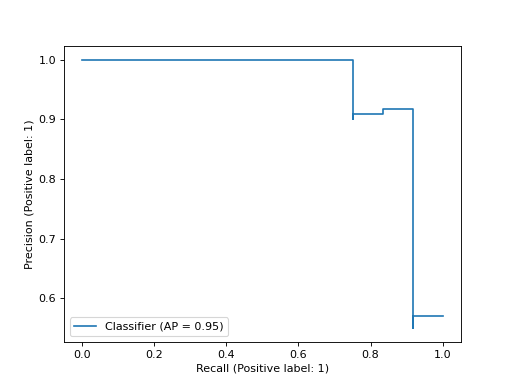
Precision Recall visualization.
It is recommend to use
from_estimatororfrom_predictionsto create aPredictionRecallDisplay. All parameters are stored as attributes.Read more in the User Guide.
- Parameters
- precisionndarray
Precision values.
- recallndarray
Recall values.
- average_precisionfloat, default=None
Average precision. If None, the average precision is not shown.
- estimator_namestr, default=None
Name of estimator. If None, then the estimator name is not shown.
- pos_labelstr or int, default=None
The class considered as the positive class. If None, the class will not be shown in the legend.
New in version 0.24.
- Attributes
- line_matplotlib Artist
Precision recall curve.
- ax_matplotlib Axes
Axes with precision recall curve.
- figure_matplotlib Figure
Figure containing the curve.
See also
precision_recall_curveCompute precision-recall pairs for different probability thresholds.
PrecisionRecallDisplay.from_estimatorPlot Precision Recall Curve given a binary classifier.
PrecisionRecallDisplay.from_predictionsPlot Precision Recall Curve using predictions from a binary classifier.
Examples
>>> import matplotlib.pyplot as plt
>>> from sklearn.datasets import make_classification
>>> from sklearn.metrics import (precision_recall_curve,
...                              PrecisionRecallDisplay)
>>> from sklearn.model_selection import train_test_split
>>> from sklearn.svm import SVC
>>> X, y = make_classification(random_state=0)
>>> X_train, X_test, y_train, y_test = train_test_split(X, y,
...                                                     random_state=0)
>>> clf = SVC(random_state=0)
>>> clf.fit(X_train, y_train)
SVC(random_state=0)
>>> predictions = clf.predict(X_test)
>>> precision, recall, _ = precision_recall_curve(y_test, predictions)
>>> disp = PrecisionRecallDisplay(precision=precision, recall=recall)
>>> disp.plot()
<...>
>>> plt.show()
Methods
from_estimator(estimator, X, y, *[, ...])Plot precision-recall curve given an estimator and some data.
from_predictions(y_true, y_pred, *[, ...])Plot precision-recall curve given binary class predictions.
plot([ax, name])Plot visualization.
- classmethod from_estimator(estimator, X, y, *, sample_weight=None, pos_label=None, response_method='auto', name=None, ax=None, **kwargs)[source]
Plot precision-recall curve given an estimator and some data.
- Parameters
- estimatorestimator instance
Fitted classifier or a fitted
Pipelinein which the last estimator is a classifier.- X{array-like, sparse matrix} of shape (n_samples, n_features)
Input values.
- yarray-like of shape (n_samples,)
Target values.
- sample_weightarray-like of shape (n_samples,), default=None
Sample weights.
- pos_labelstr or int, default=None
The class considered as the positive class when computing the precision and recall metrics. By default,
estimators.classes_[1]is considered as the positive class.- response_method{‘predict_proba’, ‘decision_function’, ‘auto’}, default=’auto’
Specifies whether to use predict_proba or decision_function as the target response. If set to ‘auto’, predict_proba is tried first and if it does not exist decision_function is tried next.
- namestr, default=None
Name for labeling curve. If
None, no name is used.- axmatplotlib axes, default=None
Axes object to plot on. If
None, a new figure and axes is created.- **kwargsdict
Keyword arguments to be passed to matplotlib’s
plot.
- Returns
- display
PrecisionRecallDisplay
- display
See also
PrecisionRecallDisplay.from_predictionsPlot precision-recall curve using estimated probabilities or output of decision function.
Examples
>>> import matplotlib.pyplot as plt
>>> from sklearn.datasets import make_classification
>>> from sklearn.metrics import PrecisionRecallDisplay
>>> from sklearn.model_selection import train_test_split
>>> from sklearn.linear_model import LogisticRegression
>>> X, y = make_classification(random_state=0)
>>> X_train, X_test, y_train, y_test = train_test_split(
...         X, y, random_state=0)
>>> clf = LogisticRegression()
>>> clf.fit(X_train, y_train)
LogisticRegression()
>>> PrecisionRecallDisplay.from_estimator(
...    clf, X_test, y_test)
<...>
>>> plt.show()
- classmethod from_predictions(y_true, y_pred, *, sample_weight=None, pos_label=None, name=None, ax=None, **kwargs)[source]
Plot precision-recall curve given binary class predictions.
- Parameters
- y_truearray-like of shape (n_samples,)
True binary labels.
- y_predarray-like of shape (n_samples,)
Estimated probabilities or output of decision function.
- sample_weightarray-like of shape (n_samples,), default=None
Sample weights.
- pos_labelstr or int, default=None
The class considered as the positive class when computing the precision and recall metrics.
- namestr, default=None
Name for labeling curve. If
None, name will be set to"Classifier".- axmatplotlib axes, default=None
Axes object to plot on. If
None, a new figure and axes is created.- **kwargsdict
Keyword arguments to be passed to matplotlib’s
plot.
- Returns
- display
PrecisionRecallDisplay
- display
See also
PrecisionRecallDisplay.from_estimatorPlot precision-recall curve using an estimator.
Examples
>>> import matplotlib.pyplot as plt
>>> from sklearn.datasets import make_classification
>>> from sklearn.metrics import PrecisionRecallDisplay
>>> from sklearn.model_selection import train_test_split
>>> from sklearn.linear_model import LogisticRegression
>>> X, y = make_classification(random_state=0)
>>> X_train, X_test, y_train, y_test = train_test_split(
...         X, y, random_state=0)
>>> clf = LogisticRegression()
>>> clf.fit(X_train, y_train)
LogisticRegression()
>>> y_pred = clf.predict_proba(X_test)[:, 1]
>>> PrecisionRecallDisplay.from_predictions(
...    y_test, y_pred)
<...>
>>> plt.show()
- plot(ax=None, *, name=None, **kwargs)[source]
Plot visualization.
Extra keyword arguments will be passed to matplotlib’s
plot.- Parameters
- axMatplotlib Axes, default=None
Axes object to plot on. If
None, a new figure and axes is created.- namestr, default=None
Name of precision recall curve for labeling. If
None, useestimator_nameif notNone, otherwise no labeling is shown.- **kwargsdict
Keyword arguments to be passed to matplotlib’s
plot.
- Returns
- display
PrecisionRecallDisplay Object that stores computed values.
- display