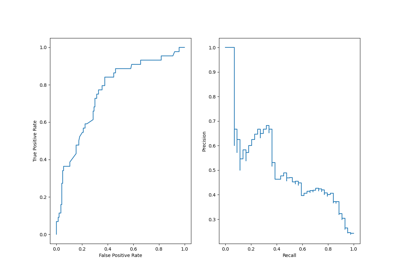
sklearn.metrics.PrecisionRecallDisplay
-
class
sklearn.metrics.PrecisionRecallDisplay(precision, recall, *, average_precision=None, estimator_name=None)[source]¶ Precision Recall visualization.
It is recommend to use
plot_precision_recall_curveto create a visualizer. All parameters are stored as attributes.Read more in the User Guide.
- Parameters
- precisionndarray
Precision values.
- recallndarray
Recall values.
- average_precisionfloat, default=None
Average precision. If None, the average precision is not shown.
- estimator_namestr, default=None
Name of estimator. If None, then the estimator name is not shown.
- Attributes
- line_matplotlib Artist
Precision recall curve.
- ax_matplotlib Axes
Axes with precision recall curve.
- figure_matplotlib Figure
Figure containing the curve.
Methods
plot([ax, name])Plot visualization.
-
__init__(precision, recall, *, average_precision=None, estimator_name=None)[source]¶ Initialize self. See help(type(self)) for accurate signature.
-
plot(ax=None, *, name=None, **kwargs)[source]¶ Plot visualization.
Extra keyword arguments will be passed to matplotlib’s
plot.- Parameters
- axMatplotlib Axes, default=None
Axes object to plot on. If
None, a new figure and axes is created.- namestr, default=None
Name of precision recall curve for labeling. If
None, use the name of the estimator.- **kwargsdict
Keyword arguments to be passed to matplotlib’s
plot.
- Returns
- display
PrecisionRecallDisplay Object that stores computed values.
- display

