sklearn.inspection.PartialDependenceDisplay
-
class
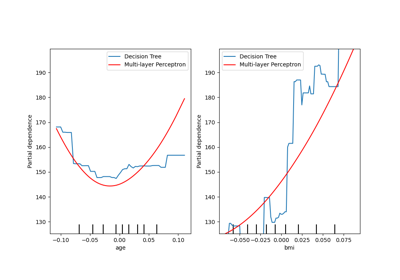
sklearn.inspection.PartialDependenceDisplay(pd_results, *, features, feature_names, target_idx, pdp_lim, deciles)[source]¶ Partial Dependence Plot (PDP) visualization.
It is recommended to use
plot_partial_dependenceto create aPartialDependenceDisplay. All parameters are stored as attributes.Read more in Advanced Plotting With Partial Dependence and the User Guide.
New in version 0.22.
- Parameters
- pd_resultslist of (ndarray, ndarray)
Results of
partial_dependenceforfeatures. Each tuple corresponds to a (averaged_predictions, grid).- featureslist of (int,) or list of (int, int)
Indices of features for a given plot. A tuple of one integer will plot a partial dependence curve of one feature. A tuple of two integers will plot a two-way partial dependence curve as a contour plot.
- feature_nameslist of str
Feature names corresponding to the indices in
features.- target_idxint
In a multiclass setting, specifies the class for which the PDPs should be computed. Note that for binary classification, the positive class (index 1) is always used.
In a multioutput setting, specifies the task for which the PDPs should be computed.
Ignored in binary classification or classical regression settings.
- pdp_limdict
Global min and max average predictions, such that all plots will have the same scale and y limits.
pdp_lim[1]is the global min and max for single partial dependence curves.pdp_lim[2]is the global min and max for two-way partial dependence curves.- decilesdict
Deciles for feature indices in
features.
- Attributes
- bounding_ax_matplotlib Axes or None
If
axis an axes or None, thebounding_ax_is the axes where the grid of partial dependence plots are drawn. Ifaxis a list of axes or a numpy array of axes,bounding_ax_is None.- axes_ndarray of matplotlib Axes
If
axis an axes or None,axes_[i, j]is the axes on the i-th row and j-th column. Ifaxis a list of axes,axes_[i]is the i-th item inax. Elements that are None correspond to a nonexisting axes in that position.- lines_ndarray of matplotlib Artists
If
axis an axes or None,lines_[i, j]is the partial dependence curve on the i-th row and j-th column. Ifaxis a list of axes,lines_[i]is the partial dependence curve corresponding to the i-th item inax. Elements that are None correspond to a nonexisting axes or an axes that does not include a line plot.- deciles_vlines_ndarray of matplotlib LineCollection
If
axis an axes or None,vlines_[i, j]is the line collection representing the x axis deciles of the i-th row and j-th column. Ifaxis a list of axes,vlines_[i]corresponds to the i-th item inax. Elements that are None correspond to a nonexisting axes or an axes that does not include a PDP plot. .. versionadded:: 0.23- deciles_hlines_ndarray of matplotlib LineCollection
If
axis an axes or None,vlines_[i, j]is the line collection representing the y axis deciles of the i-th row and j-th column. Ifaxis a list of axes,vlines_[i]corresponds to the i-th item inax. Elements that are None correspond to a nonexisting axes or an axes that does not include a 2-way plot. .. versionadded:: 0.23- contours_ndarray of matplotlib Artists
If
axis an axes or None,contours_[i, j]is the partial dependence plot on the i-th row and j-th column. Ifaxis a list of axes,contours_[i]is the partial dependence plot corresponding to the i-th item inax. Elements that are None correspond to a nonexisting axes or an axes that does not include a contour plot.- figure_matplotlib Figure
Figure containing partial dependence plots.
Methods
plot([ax, n_cols, line_kw, contour_kw])Plot partial dependence plots.
-
__init__(pd_results, *, features, feature_names, target_idx, pdp_lim, deciles)[source]¶ Initialize self. See help(type(self)) for accurate signature.
-
plot(ax=None, n_cols=3, line_kw=None, contour_kw=None)[source]¶ Plot partial dependence plots.
- Parameters
- axMatplotlib axes or array-like of Matplotlib axes, default=None
- If a single axis is passed in, it is treated as a bounding axes
and a grid of partial dependence plots will be drawn within these bounds. The
n_colsparameter controls the number of columns in the grid.
- If an array-like of axes are passed in, the partial dependence
plots will be drawn directly into these axes.
- If
None, a figure and a bounding axes is created and treated as the single axes case.
- If
- n_colsint, default=3
The maximum number of columns in the grid plot. Only active when
axis a single axes orNone.- line_kwdict, default=None
Dict with keywords passed to the
matplotlib.pyplot.plotcall. For one-way partial dependence plots.- contour_kwdict, default=None
Dict with keywords passed to the
matplotlib.pyplot.contourfcall for two-way partial dependence plots.
- Returns
- display:
PartialDependenceDisplay
- display: