
Note
Click here to download the full example code
Early stopping of Gradient Boosting
Gradient boosting is an ensembling technique where several weak learners (regression trees) are combined to yield a powerful single model, in an iterative fashion.
Early stopping support in Gradient Boosting enables us to find the least number of iterations which is sufficient to build a model that generalizes well to unseen data.
The concept of early stopping is simple. We specify a validation_fraction
which denotes the fraction of the whole dataset that will be kept aside from
training to assess the validation loss of the model. The gradient boosting
model is trained using the training set and evaluated using the validation set.
When each additional stage of regression tree is added, the validation set is
used to score the model. This is continued until the scores of the model in
the last n_iter_no_change stages do not improve by atleast tol. After
that the model is considered to have converged and further addition of stages
is “stopped early”.
The number of stages of the final model is available at the attribute
n_estimators_.
This example illustrates how the early stopping can used in the
sklearn.ensemble.GradientBoostingClassifier model to achieve
almost the same accuracy as compared to a model built without early stopping
using many fewer estimators. This can significantly reduce training time,
memory usage and prediction latency.
# Authors: Vighnesh Birodkar <vighneshbirodkar@nyu.edu>
#          Raghav RV <rvraghav93@gmail.com>
# License: BSD 3 clause

import time

import numpy as np
import matplotlib.pyplot as plt

from sklearn import ensemble
from sklearn import datasets
from sklearn.model_selection import train_test_split

print(__doc__)

data_list = [datasets.load_iris(), datasets.load_digits()]
data_list = [(d.data, d.target) for d in data_list]
data_list += [datasets.make_hastie_10_2()]
names = ['Iris Data', 'Digits Data', 'Hastie Data']

n_gb = []
score_gb = []
time_gb = []
n_gbes = []
score_gbes = []
time_gbes = []

n_estimators = 500

for X, y in data_list:
    X_train, X_test, y_train, y_test = train_test_split(X, y, test_size=0.2,
                                                        random_state=0)

    # We specify that if the scores don't improve by atleast 0.01 for the last
    # 10 stages, stop fitting additional stages
    gbes = ensemble.GradientBoostingClassifier(n_estimators=n_estimators,
                                               validation_fraction=0.2,
                                               n_iter_no_change=5, tol=0.01,
                                               random_state=0)
    gb = ensemble.GradientBoostingClassifier(n_estimators=n_estimators,
                                             random_state=0)
    start = time.time()
    gb.fit(X_train, y_train)
    time_gb.append(time.time() - start)

    start = time.time()
    gbes.fit(X_train, y_train)
    time_gbes.append(time.time() - start)

    score_gb.append(gb.score(X_test, y_test))
    score_gbes.append(gbes.score(X_test, y_test))

    n_gb.append(gb.n_estimators_)
    n_gbes.append(gbes.n_estimators_)

bar_width = 0.2
n = len(data_list)
index = np.arange(0, n * bar_width, bar_width) * 2.5
index = index[0:n]
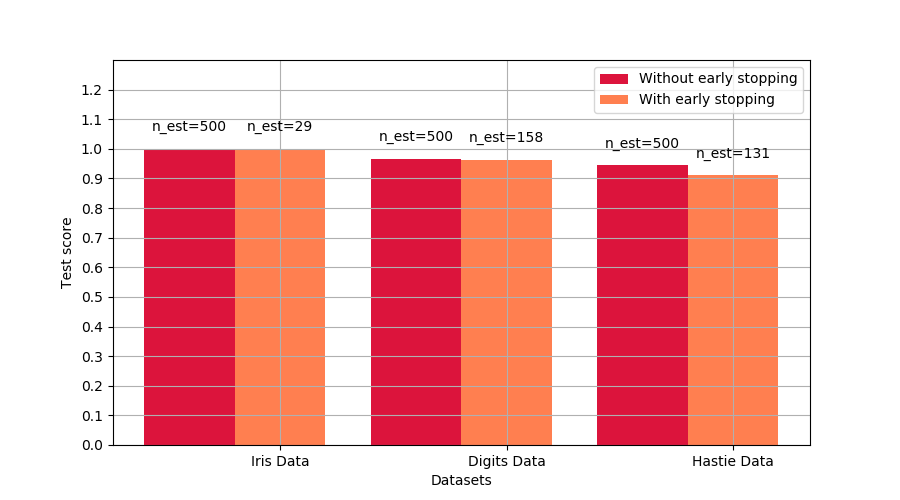
Compare scores with and without early stopping
plt.figure(figsize=(9, 5))

bar1 = plt.bar(index, score_gb, bar_width, label='Without early stopping',
               color='crimson')
bar2 = plt.bar(index + bar_width, score_gbes, bar_width,
               label='With early stopping', color='coral')

plt.xticks(index + bar_width, names)
plt.yticks(np.arange(0, 1.3, 0.1))


def autolabel(rects, n_estimators):
    """
    Attach a text label above each bar displaying n_estimators of each model
    """
    for i, rect in enumerate(rects):
        plt.text(rect.get_x() + rect.get_width() / 2.,
                 1.05 * rect.get_height(), 'n_est=%d' % n_estimators[i],
                 ha='center', va='bottom')


autolabel(bar1, n_gb)
autolabel(bar2, n_gbes)

plt.ylim([0, 1.3])
plt.legend(loc='best')
plt.grid(True)

plt.xlabel('Datasets')
plt.ylabel('Test score')

plt.show()
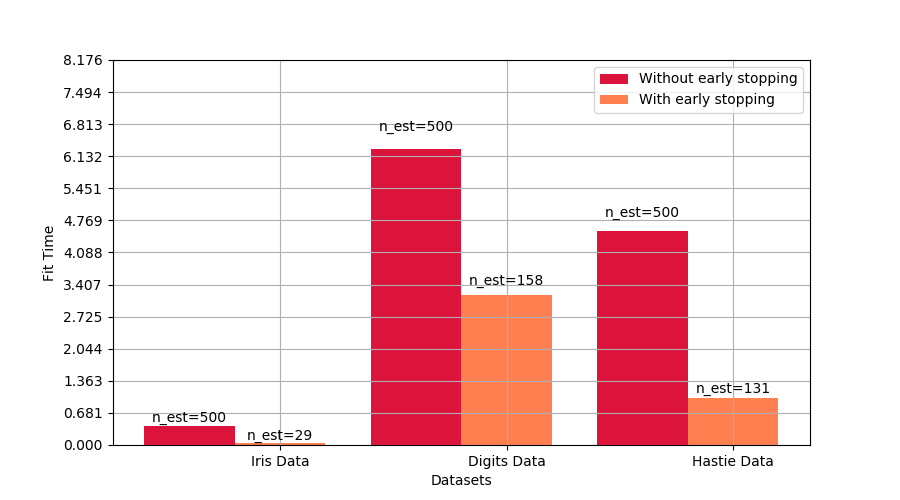
Compare fit times with and without early stopping
plt.figure(figsize=(9, 5))

bar1 = plt.bar(index, time_gb, bar_width, label='Without early stopping',
               color='crimson')
bar2 = plt.bar(index + bar_width, time_gbes, bar_width,
               label='With early stopping', color='coral')

max_y = np.amax(np.maximum(time_gb, time_gbes))

plt.xticks(index + bar_width, names)
plt.yticks(np.linspace(0, 1.3 * max_y, 13))

autolabel(bar1, n_gb)
autolabel(bar2, n_gbes)

plt.ylim([0, 1.3 * max_y])
plt.legend(loc='best')
plt.grid(True)

plt.xlabel('Datasets')
plt.ylabel('Fit Time')

plt.show()
Total running time of the script: ( 0 minutes 15.622 seconds)