
Note
Click here to download the full example code
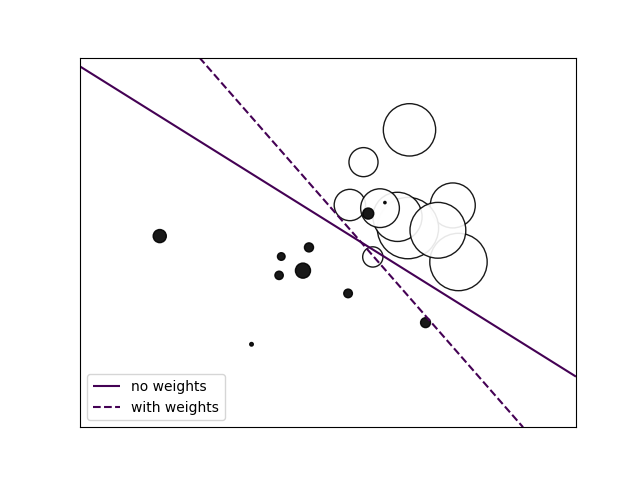
SGD: Weighted samples
Plot decision function of a weighted dataset, where the size of points is proportional to its weight.
Out:
/home/circleci/project/sklearn/linear_model/stochastic_gradient.py:183: FutureWarning: max_iter and tol parameters have been added in SGDClassifier in 0.19. If max_iter is set but tol is left unset, the default value for tol in 0.19 and 0.20 will be None (which is equivalent to -infinity, so it has no effect) but will change in 0.21 to 1e-3. Specify tol to silence this warning.
  FutureWarning)
print(__doc__)

import numpy as np
import matplotlib.pyplot as plt
from sklearn import linear_model

# we create 20 points
np.random.seed(0)
X = np.r_[np.random.randn(10, 2) + [1, 1], np.random.randn(10, 2)]
y = [1] * 10 + [-1] * 10
sample_weight = 100 * np.abs(np.random.randn(20))
# and assign a bigger weight to the last 10 samples
sample_weight[:10] *= 10

# plot the weighted data points
xx, yy = np.meshgrid(np.linspace(-4, 5, 500), np.linspace(-4, 5, 500))
plt.figure()
plt.scatter(X[:, 0], X[:, 1], c=y, s=sample_weight, alpha=0.9,
            cmap=plt.cm.bone, edgecolor='black')

# fit the unweighted model
clf = linear_model.SGDClassifier(alpha=0.01, max_iter=100)
clf.fit(X, y)
Z = clf.decision_function(np.c_[xx.ravel(), yy.ravel()])
Z = Z.reshape(xx.shape)
no_weights = plt.contour(xx, yy, Z, levels=[0], linestyles=['solid'])

# fit the weighted model
clf = linear_model.SGDClassifier(alpha=0.01, max_iter=100)
clf.fit(X, y, sample_weight=sample_weight)
Z = clf.decision_function(np.c_[xx.ravel(), yy.ravel()])
Z = Z.reshape(xx.shape)
samples_weights = plt.contour(xx, yy, Z, levels=[0], linestyles=['dashed'])

plt.legend([no_weights.collections[0], samples_weights.collections[0]],
           ["no weights", "with weights"], loc="lower left")

plt.xticks(())
plt.yticks(())
plt.show()
Total running time of the script: ( 0 minutes 0.199 seconds)