
Note
Click here to download the full example code
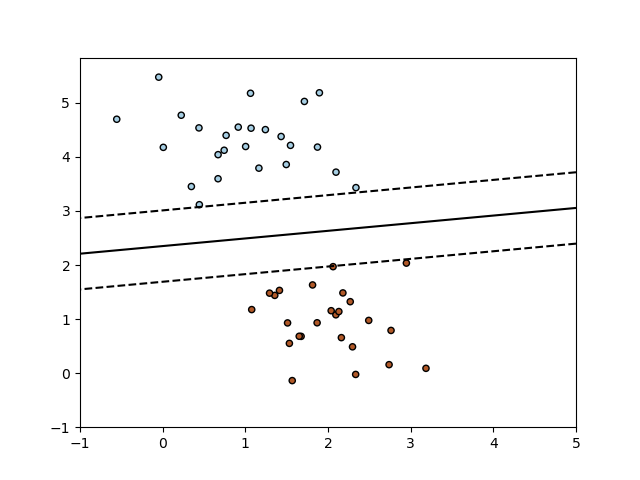
SGD: Maximum margin separating hyperplane
Plot the maximum margin separating hyperplane within a two-class separable dataset using a linear Support Vector Machines classifier trained using SGD.
Out:
/home/circleci/project/sklearn/linear_model/stochastic_gradient.py:183: FutureWarning: max_iter and tol parameters have been added in SGDClassifier in 0.19. If max_iter is set but tol is left unset, the default value for tol in 0.19 and 0.20 will be None (which is equivalent to -infinity, so it has no effect) but will change in 0.21 to 1e-3. Specify tol to silence this warning.
  FutureWarning)
print(__doc__)

import numpy as np
import matplotlib.pyplot as plt
from sklearn.linear_model import SGDClassifier
from sklearn.datasets.samples_generator import make_blobs

# we create 50 separable points
X, Y = make_blobs(n_samples=50, centers=2, random_state=0, cluster_std=0.60)

# fit the model
clf = SGDClassifier(loss="hinge", alpha=0.01, max_iter=200, fit_intercept=True)
clf.fit(X, Y)

# plot the line, the points, and the nearest vectors to the plane
xx = np.linspace(-1, 5, 10)
yy = np.linspace(-1, 5, 10)

X1, X2 = np.meshgrid(xx, yy)
Z = np.empty(X1.shape)
for (i, j), val in np.ndenumerate(X1):
    x1 = val
    x2 = X2[i, j]
    p = clf.decision_function([[x1, x2]])
    Z[i, j] = p[0]
levels = [-1.0, 0.0, 1.0]
linestyles = ['dashed', 'solid', 'dashed']
colors = 'k'
plt.contour(X1, X2, Z, levels, colors=colors, linestyles=linestyles)
plt.scatter(X[:, 0], X[:, 1], c=Y, cmap=plt.cm.Paired,
            edgecolor='black', s=20)

plt.axis('tight')
plt.show()
Total running time of the script: ( 0 minutes 0.156 seconds)