sklearn.metrics.average_precision_score
-
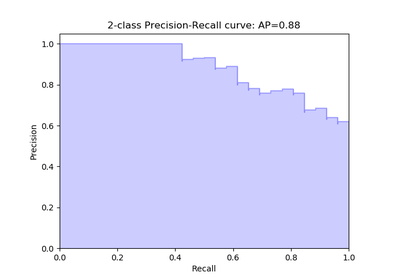
sklearn.metrics.average_precision_score(y_true, y_score, average=’macro’, sample_weight=None)[source]¶ Compute average precision (AP) from prediction scores
AP summarizes a precision-recall curve as the weighted mean of precisions achieved at each threshold, with the increase in recall from the previous threshold used as the weight:
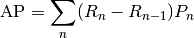
where
 and
and  are the precision and recall at the nth
threshold [R199]. This implementation is not interpolated and is different
from computing the area under the precision-recall curve with the
trapezoidal rule, which uses linear interpolation and can be too
optimistic.
are the precision and recall at the nth
threshold [R199]. This implementation is not interpolated and is different
from computing the area under the precision-recall curve with the
trapezoidal rule, which uses linear interpolation and can be too
optimistic.Note: this implementation is restricted to the binary classification task or multilabel classification task.
Read more in the User Guide.
Parameters: y_true : array, shape = [n_samples] or [n_samples, n_classes]
True binary labels in binary label indicators.
y_score : array, shape = [n_samples] or [n_samples, n_classes]
Target scores, can either be probability estimates of the positive class, confidence values, or non-thresholded measure of decisions (as returned by “decision_function” on some classifiers).
average : string, [None, ‘micro’, ‘macro’ (default), ‘samples’, ‘weighted’]
If
None, the scores for each class are returned. Otherwise, this determines the type of averaging performed on the data:'micro':Calculate metrics globally by considering each element of the label indicator matrix as a label.
'macro':Calculate metrics for each label, and find their unweighted mean. This does not take label imbalance into account.
'weighted':Calculate metrics for each label, and find their average, weighted by support (the number of true instances for each label).
'samples':Calculate metrics for each instance, and find their average.
sample_weight : array-like of shape = [n_samples], optional
Sample weights.
Returns: average_precision : float
See also
roc_auc_score- Compute the area under the ROC curve
precision_recall_curve- Compute precision-recall pairs for different probability thresholds
References
[R199] (1, 2) Wikipedia entry for the Average precision Examples
>>> import numpy as np
>>> from sklearn.metrics import average_precision_score
>>> y_true = np.array([0, 0, 1, 1])
>>> y_scores = np.array([0.1, 0.4, 0.35, 0.8])
>>> average_precision_score(y_true, y_scores)
0.83...