sklearn.ensemble.partial_dependence.plot_partial_dependence
-
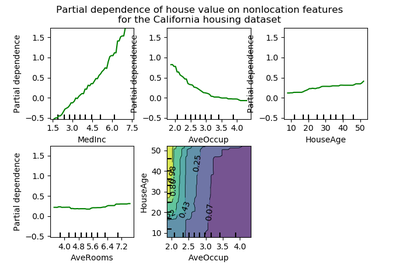
sklearn.ensemble.partial_dependence.plot_partial_dependence(gbrt, X, features, feature_names=None, label=None, n_cols=3, grid_resolution=100, percentiles=(0.05, 0.95), n_jobs=1, verbose=0, ax=None, line_kw=None, contour_kw=None, **fig_kw)[source]¶ Partial dependence plots for
features.The
len(features)plots are arranged in a grid withn_colscolumns. Two-way partial dependence plots are plotted as contour plots.Read more in the User Guide.
Parameters: gbrt : BaseGradientBoosting
A fitted gradient boosting model.
X : array-like, shape=(n_samples, n_features)
The data on which
gbrtwas trained.features : seq of ints, strings, or tuples of ints or strings
If seq[i] is an int or a tuple with one int value, a one-way PDP is created; if seq[i] is a tuple of two ints, a two-way PDP is created. If feature_names is specified and seq[i] is an int, seq[i] must be < len(feature_names). If seq[i] is a string, feature_names must be specified, and seq[i] must be in feature_names.
feature_names : seq of str
Name of each feature; feature_names[i] holds the name of the feature with index i.
label : object
The class label for which the PDPs should be computed. Only if gbrt is a multi-class model. Must be in
gbrt.classes_.n_cols : int
The number of columns in the grid plot (default: 3).
percentiles : (low, high), default=(0.05, 0.95)
The lower and upper percentile used to create the extreme values for the PDP axes.
grid_resolution : int, default=100
The number of equally spaced points on the axes.
n_jobs : int
The number of CPUs to use to compute the PDs. -1 means ‘all CPUs’. Defaults to 1.
verbose : int
Verbose output during PD computations. Defaults to 0.
ax : Matplotlib axis object, default None
An axis object onto which the plots will be drawn.
line_kw : dict
Dict with keywords passed to the
matplotlib.pyplot.plotcall. For one-way partial dependence plots.contour_kw : dict
Dict with keywords passed to the
matplotlib.pyplot.plotcall. For two-way partial dependence plots.fig_kw : dict
Dict with keywords passed to the figure() call. Note that all keywords not recognized above will be automatically included here.
Returns: fig : figure
The Matplotlib Figure object.
axs : seq of Axis objects
A seq of Axis objects, one for each subplot.
Examples
>>> from sklearn.datasets import make_friedman1
>>> from sklearn.ensemble import GradientBoostingRegressor
>>> X, y = make_friedman1()
>>> clf = GradientBoostingRegressor(n_estimators=10).fit(X, y)
>>> fig, axs = plot_partial_dependence(clf, X, [0, (0, 1)])
...