
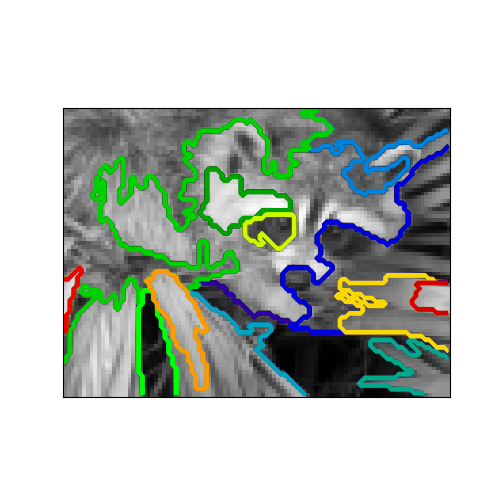
A demo of structured Ward hierarchical clustering on a raccoon face image
Compute the segmentation of a 2D image with Ward hierarchical clustering. The clustering is spatially constrained in order for each segmented region to be in one piece.
Out:
Compute structured hierarchical clustering...
Elapsed time:  0.6450910568237305
Number of pixels:  7752
Number of clusters:  15
# Author : Vincent Michel, 2010
#          Alexandre Gramfort, 2011
# License: BSD 3 clause

print(__doc__)

import time as time

import numpy as np
import scipy as sp

import matplotlib.pyplot as plt

from sklearn.feature_extraction.image import grid_to_graph
from sklearn.cluster import AgglomerativeClustering


# #############################################################################
# Generate data
try:  # SciPy >= 0.16 have face in misc
    from scipy.misc import face
    face = face(gray=True)
except ImportError:
    face = sp.face(gray=True)

# Resize it to 10% of the original size to speed up the processing
face = sp.misc.imresize(face, 0.10) / 255.

X = np.reshape(face, (-1, 1))

# #############################################################################
# Define the structure A of the data. Pixels connected to their neighbors.
connectivity = grid_to_graph(*face.shape)

# #############################################################################
# Compute clustering
print("Compute structured hierarchical clustering...")
st = time.time()
n_clusters = 15  # number of regions
ward = AgglomerativeClustering(n_clusters=n_clusters, linkage='ward',
                               connectivity=connectivity)
ward.fit(X)
label = np.reshape(ward.labels_, face.shape)
print("Elapsed time: ", time.time() - st)
print("Number of pixels: ", label.size)
print("Number of clusters: ", np.unique(label).size)

# #############################################################################
# Plot the results on an image
plt.figure(figsize=(5, 5))
plt.imshow(face, cmap=plt.cm.gray)
for l in range(n_clusters):
    plt.contour(label == l, contours=1,
                colors=[plt.cm.nipy_spectral(l / float(n_clusters)), ])
plt.xticks(())
plt.yticks(())
plt.show()
Total running time of the script: ( 0 minutes 0.958 seconds)