
Adjustment for chance in clustering performance evaluation
The following plots demonstrate the impact of the number of clusters and number of samples on various clustering performance evaluation metrics.
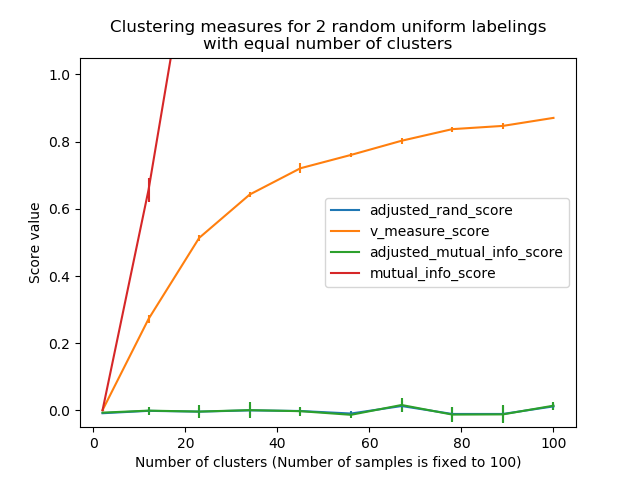
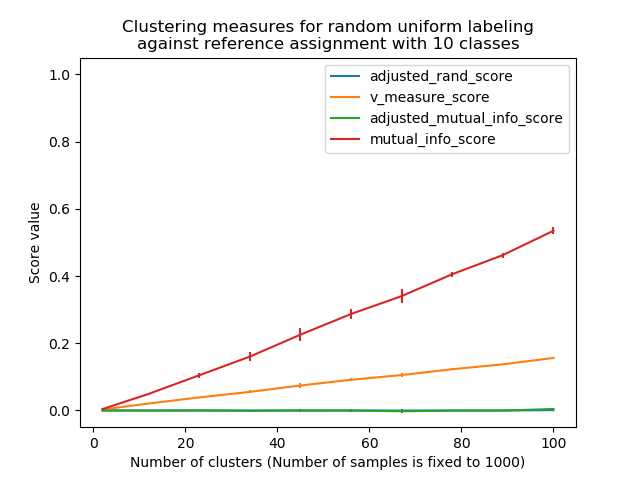
Non-adjusted measures such as the V-Measure show a dependency between the number of clusters and the number of samples: the mean V-Measure of random labeling increases significantly as the number of clusters is closer to the total number of samples used to compute the measure.
Adjusted for chance measure such as ARI display some random variations centered around a mean score of 0.0 for any number of samples and clusters.
Only adjusted measures can hence safely be used as a consensus index to evaluate the average stability of clustering algorithms for a given value of k on various overlapping sub-samples of the dataset.
Out:
Computing adjusted_rand_score for 10 values of n_clusters and n_samples=100
done in 0.041s
Computing v_measure_score for 10 values of n_clusters and n_samples=100
done in 0.063s
Computing adjusted_mutual_info_score for 10 values of n_clusters and n_samples=100
done in 0.602s
Computing mutual_info_score for 10 values of n_clusters and n_samples=100
done in 0.052s
Computing adjusted_rand_score for 10 values of n_clusters and n_samples=1000
done in 0.060s
Computing v_measure_score for 10 values of n_clusters and n_samples=1000
done in 0.082s
Computing adjusted_mutual_info_score for 10 values of n_clusters and n_samples=1000
done in 0.337s
Computing mutual_info_score for 10 values of n_clusters and n_samples=1000
done in 0.068s
print(__doc__)

# Author: Olivier Grisel <olivier.grisel@ensta.org>
# License: BSD 3 clause

import numpy as np
import matplotlib.pyplot as plt
from time import time
from sklearn import metrics


def uniform_labelings_scores(score_func, n_samples, n_clusters_range,
                             fixed_n_classes=None, n_runs=5, seed=42):
    """Compute score for 2 random uniform cluster labelings.

    Both random labelings have the same number of clusters for each value
    possible value in ``n_clusters_range``.

    When fixed_n_classes is not None the first labeling is considered a ground
    truth class assignment with fixed number of classes.
    """
    random_labels = np.random.RandomState(seed).randint
    scores = np.zeros((len(n_clusters_range), n_runs))

    if fixed_n_classes is not None:
        labels_a = random_labels(low=0, high=fixed_n_classes, size=n_samples)

    for i, k in enumerate(n_clusters_range):
        for j in range(n_runs):
            if fixed_n_classes is None:
                labels_a = random_labels(low=0, high=k, size=n_samples)
            labels_b = random_labels(low=0, high=k, size=n_samples)
            scores[i, j] = score_func(labels_a, labels_b)
    return scores

score_funcs = [
    metrics.adjusted_rand_score,
    metrics.v_measure_score,
    metrics.adjusted_mutual_info_score,
    metrics.mutual_info_score,
]

# 2 independent random clusterings with equal cluster number

n_samples = 100
n_clusters_range = np.linspace(2, n_samples, 10).astype(np.int)

plt.figure(1)

plots = []
names = []
for score_func in score_funcs:
    print("Computing %s for %d values of n_clusters and n_samples=%d"
          % (score_func.__name__, len(n_clusters_range), n_samples))

    t0 = time()
    scores = uniform_labelings_scores(score_func, n_samples, n_clusters_range)
    print("done in %0.3fs" % (time() - t0))
    plots.append(plt.errorbar(
        n_clusters_range, np.median(scores, axis=1), scores.std(axis=1))[0])
    names.append(score_func.__name__)

plt.title("Clustering measures for 2 random uniform labelings\n"
          "with equal number of clusters")
plt.xlabel('Number of clusters (Number of samples is fixed to %d)' % n_samples)
plt.ylabel('Score value')
plt.legend(plots, names)
plt.ylim(ymin=-0.05, ymax=1.05)


# Random labeling with varying n_clusters against ground class labels
# with fixed number of clusters

n_samples = 1000
n_clusters_range = np.linspace(2, 100, 10).astype(np.int)
n_classes = 10

plt.figure(2)

plots = []
names = []
for score_func in score_funcs:
    print("Computing %s for %d values of n_clusters and n_samples=%d"
          % (score_func.__name__, len(n_clusters_range), n_samples))

    t0 = time()
    scores = uniform_labelings_scores(score_func, n_samples, n_clusters_range,
                                      fixed_n_classes=n_classes)
    print("done in %0.3fs" % (time() - t0))
    plots.append(plt.errorbar(
        n_clusters_range, scores.mean(axis=1), scores.std(axis=1))[0])
    names.append(score_func.__name__)

plt.title("Clustering measures for random uniform labeling\n"
          "against reference assignment with %d classes" % n_classes)
plt.xlabel('Number of clusters (Number of samples is fixed to %d)' % n_samples)
plt.ylabel('Score value')
plt.ylim(ymin=-0.05, ymax=1.05)
plt.legend(plots, names)
plt.show()
Total running time of the script: ( 0 minutes 1.372 seconds)