
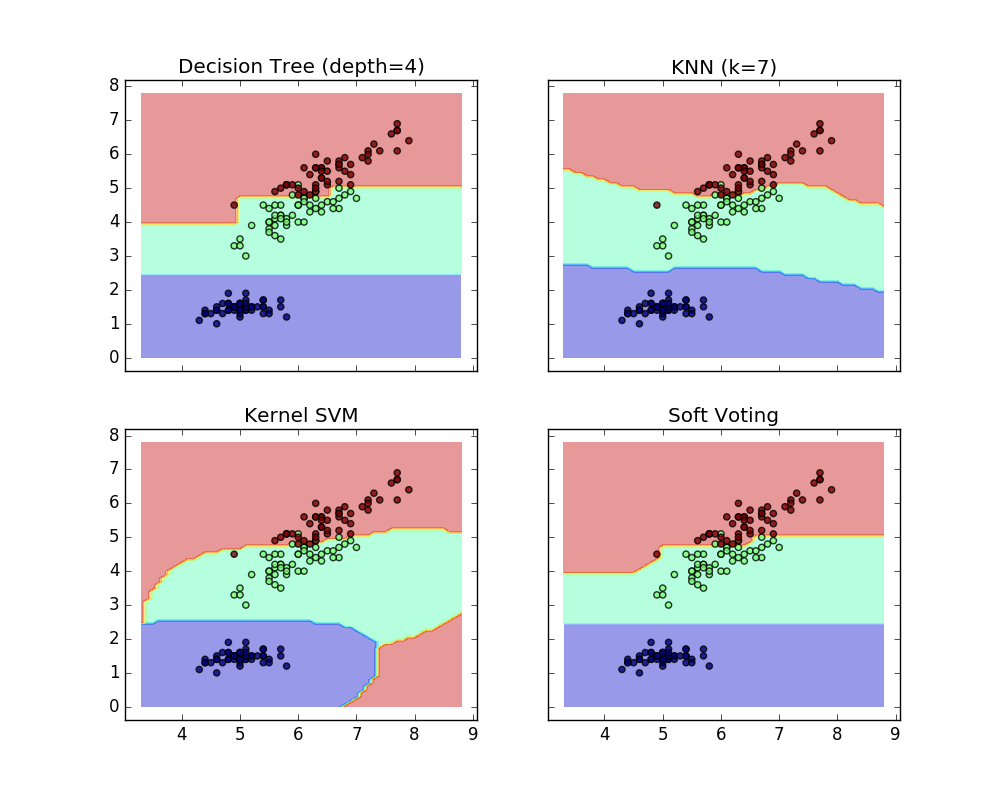
Plot the decision boundaries of a VotingClassifier
Plot the decision boundaries of a VotingClassifier for two features of the Iris dataset.
Plot the class probabilities of the first sample in a toy dataset predicted by three different classifiers and averaged by the VotingClassifier.
First, three exemplary classifiers are initialized (DecisionTreeClassifier, KNeighborsClassifier, and SVC) and used to initialize a soft-voting VotingClassifier with weights [2, 1, 2], which means that the predicted probabilities of the DecisionTreeClassifier and SVC count 5 times as much as the weights of the KNeighborsClassifier classifier when the averaged probability is calculated.
print(__doc__)

from itertools import product

import numpy as np
import matplotlib.pyplot as plt

from sklearn import datasets
from sklearn.tree import DecisionTreeClassifier
from sklearn.neighbors import KNeighborsClassifier
from sklearn.svm import SVC
from sklearn.ensemble import VotingClassifier

# Loading some example data
iris = datasets.load_iris()
X = iris.data[:, [0, 2]]
y = iris.target

# Training classifiers
clf1 = DecisionTreeClassifier(max_depth=4)
clf2 = KNeighborsClassifier(n_neighbors=7)
clf3 = SVC(kernel='rbf', probability=True)
eclf = VotingClassifier(estimators=[('dt', clf1), ('knn', clf2),
                                    ('svc', clf3)],
                        voting='soft', weights=[2, 1, 2])

clf1.fit(X, y)
clf2.fit(X, y)
clf3.fit(X, y)
eclf.fit(X, y)

# Plotting decision regions
x_min, x_max = X[:, 0].min() - 1, X[:, 0].max() + 1
y_min, y_max = X[:, 1].min() - 1, X[:, 1].max() + 1
xx, yy = np.meshgrid(np.arange(x_min, x_max, 0.1),
                     np.arange(y_min, y_max, 0.1))

f, axarr = plt.subplots(2, 2, sharex='col', sharey='row', figsize=(10, 8))

for idx, clf, tt in zip(product([0, 1], [0, 1]),
                        [clf1, clf2, clf3, eclf],
                        ['Decision Tree (depth=4)', 'KNN (k=7)',
                         'Kernel SVM', 'Soft Voting']):

    Z = clf.predict(np.c_[xx.ravel(), yy.ravel()])
    Z = Z.reshape(xx.shape)

    axarr[idx[0], idx[1]].contourf(xx, yy, Z, alpha=0.4)
    axarr[idx[0], idx[1]].scatter(X[:, 0], X[:, 1], c=y, alpha=0.8)
    axarr[idx[0], idx[1]].set_title(tt)

plt.show()
Total running time of the script: (0 minutes 0.326 seconds)
Download Python source code:
plot_voting_decision_regions.py
Download IPython notebook:
plot_voting_decision_regions.ipynb