
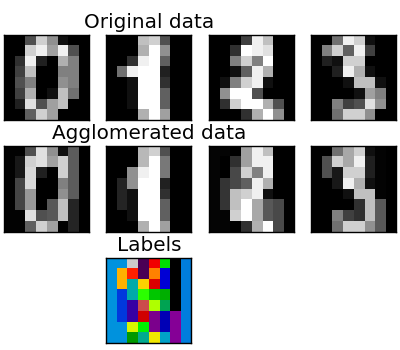
Feature agglomeration
These images how similar features are merged together using feature agglomeration.
print(__doc__)

# Code source: Gaël Varoquaux
# Modified for documentation by Jaques Grobler
# License: BSD 3 clause

import numpy as np
import matplotlib.pyplot as plt

from sklearn import datasets, cluster
from sklearn.feature_extraction.image import grid_to_graph

digits = datasets.load_digits()
images = digits.images
X = np.reshape(images, (len(images), -1))
connectivity = grid_to_graph(*images[0].shape)

agglo = cluster.FeatureAgglomeration(connectivity=connectivity,
                                     n_clusters=32)

agglo.fit(X)
X_reduced = agglo.transform(X)

X_restored = agglo.inverse_transform(X_reduced)
images_restored = np.reshape(X_restored, images.shape)
plt.figure(1, figsize=(4, 3.5))
plt.clf()
plt.subplots_adjust(left=.01, right=.99, bottom=.01, top=.91)
for i in range(4):
    plt.subplot(3, 4, i + 1)
    plt.imshow(images[i], cmap=plt.cm.gray, vmax=16, interpolation='nearest')
    plt.xticks(())
    plt.yticks(())
    if i == 1:
        plt.title('Original data')
    plt.subplot(3, 4, 4 + i + 1)
    plt.imshow(images_restored[i], cmap=plt.cm.gray, vmax=16,
               interpolation='nearest')
    if i == 1:
        plt.title('Agglomerated data')
    plt.xticks(())
    plt.yticks(())

plt.subplot(3, 4, 10)
plt.imshow(np.reshape(agglo.labels_, images[0].shape),
           interpolation='nearest', cmap=plt.cm.spectral)
plt.xticks(())
plt.yticks(())
plt.title('Labels')
plt.show()
Total running time of the script: (0 minutes 0.799 seconds)
Download Python source code:
plot_digits_agglomeration.py
Download IPython notebook:
plot_digits_agglomeration.ipynb