
Robust linear model estimation using RANSAC
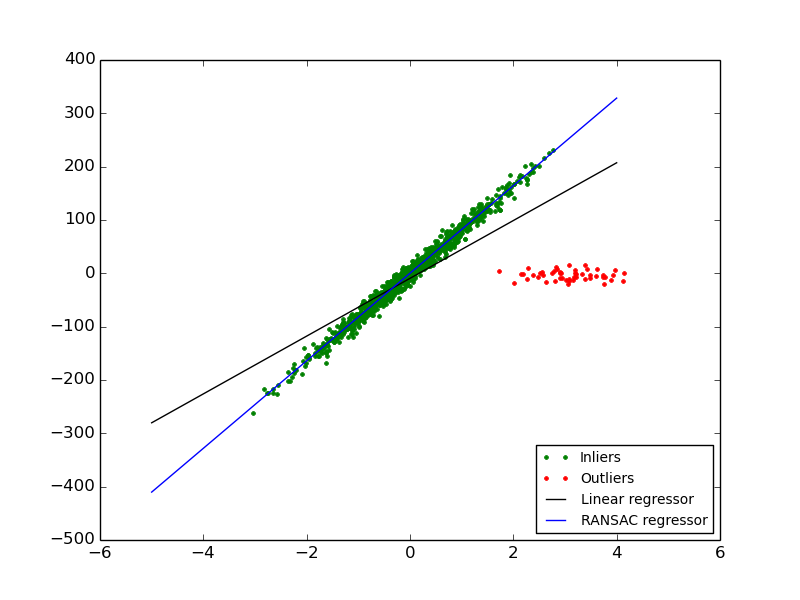
In this example we see how to robustly fit a linear model to faulty data using the RANSAC algorithm.
Script output:
Estimated coefficients (true, normal, RANSAC):
82.1903908408 [ 54.17236387] [ 82.08533159]
Python source code: plot_ransac.py
import numpy as np
from matplotlib import pyplot as plt

from sklearn import linear_model, datasets


n_samples = 1000
n_outliers = 50


X, y, coef = datasets.make_regression(n_samples=n_samples, n_features=1,
                                      n_informative=1, noise=10,
                                      coef=True, random_state=0)

# Add outlier data
np.random.seed(0)
X[:n_outliers] = 3 + 0.5 * np.random.normal(size=(n_outliers, 1))
y[:n_outliers] = -3 + 10 * np.random.normal(size=n_outliers)

# Fit line using all data
model = linear_model.LinearRegression()
model.fit(X, y)

# Robustly fit linear model with RANSAC algorithm
model_ransac = linear_model.RANSACRegressor(linear_model.LinearRegression())
model_ransac.fit(X, y)
inlier_mask = model_ransac.inlier_mask_
outlier_mask = np.logical_not(inlier_mask)

# Predict data of estimated models
line_X = np.arange(-5, 5)
line_y = model.predict(line_X[:, np.newaxis])
line_y_ransac = model_ransac.predict(line_X[:, np.newaxis])

# Compare estimated coefficients
print("Estimated coefficients (true, normal, RANSAC):")
print(coef, model.coef_, model_ransac.estimator_.coef_)

plt.plot(X[inlier_mask], y[inlier_mask], '.g', label='Inliers')
plt.plot(X[outlier_mask], y[outlier_mask], '.r', label='Outliers')
plt.plot(line_X, line_y, '-k', label='Linear regressor')
plt.plot(line_X, line_y_ransac, '-b', label='RANSAC regressor')
plt.legend(loc='lower right')
plt.show()
Total running time of the example: 0.11 seconds ( 0 minutes 0.11 seconds)