sklearn.metrics.plot_det_curve
- sklearn.metrics.plot_det_curve(estimator, X, y, *, sample_weight=None, response_method='auto', name=None, ax=None, pos_label=None, **kwargs)[source]
DEPRECATED: Function plot_det_curve is deprecated in 1.0 and will be removed in 1.2. Use one of the class methods: DetCurveDisplay.from_predictions or DetCurveDisplay.from_estimator.
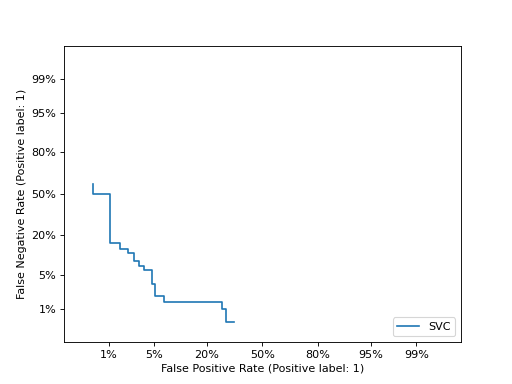
Plot detection error tradeoff (DET) curve.
Extra keyword arguments will be passed to matplotlib’s
plot.Read more in the User Guide.
New in version 0.24.
Deprecated since version 1.0:
plot_det_curveis deprecated in 1.0 and will be removed in 1.2. Use one of the following class methods:from_predictionsorfrom_estimator.- Parameters:
- estimatorestimator instance
Fitted classifier or a fitted
Pipelinein which the last estimator is a classifier.- X{array-like, sparse matrix} of shape (n_samples, n_features)
Input values.
- yarray-like of shape (n_samples,)
Target values.
- sample_weightarray-like of shape (n_samples,), default=None
Sample weights.
- response_method{‘predict_proba’, ‘decision_function’, ‘auto’} default=’auto’
Specifies whether to use predict_proba or decision_function as the predicted target response. If set to ‘auto’, predict_proba is tried first and if it does not exist decision_function is tried next.
- namestr, default=None
Name of DET curve for labeling. If
None, use the name of the estimator.- axmatplotlib axes, default=None
Axes object to plot on. If
None, a new figure and axes is created.- pos_labelstr or int, default=None
The label of the positive class. When
pos_label=None, ify_trueis in {-1, 1} or {0, 1},pos_labelis set to 1, otherwise an error will be raised.- **kwargsdict
Additional keywords arguments passed to matplotlib
plotfunction.
- Returns:
- display
DetCurveDisplay Object that stores computed values.
- display
See also
det_curveCompute error rates for different probability thresholds.
DetCurveDisplayDET curve visualization.
DetCurveDisplay.from_estimatorPlot DET curve given an estimator and some data.
DetCurveDisplay.from_predictionsPlot DET curve given the true and predicted labels.
RocCurveDisplay.from_estimatorPlot Receiver Operating Characteristic (ROC) curve given an estimator and some data.
RocCurveDisplay.from_predictionsPlot Receiver Operating Characteristic (ROC) curve given the true and predicted values.
Examples
>>> import matplotlib.pyplot as plt
>>> from sklearn.datasets import make_classification
>>> from sklearn.metrics import plot_det_curve
>>> from sklearn.model_selection import train_test_split
>>> from sklearn.svm import SVC
>>> X, y = make_classification(n_samples=1000, random_state=0)
>>> X_train, X_test, y_train, y_test = train_test_split(
...     X, y, test_size=0.4, random_state=0)
>>> clf = SVC(random_state=0).fit(X_train, y_train)
>>> plot_det_curve(clf, X_test, y_test)
<...>
>>> plt.show()