Note
Click here to download the full example code or to run this example in your browser via Binder
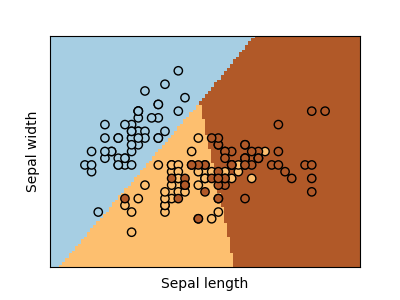
Logistic Regression 3-class Classifier
Show below is a logistic-regression classifiers decision boundaries on the first two dimensions (sepal length and width) of the iris dataset. The datapoints are colored according to their labels.
# Code source: Gaël Varoquaux
# Modified for documentation by Jaques Grobler
# License: BSD 3 clause

import matplotlib.pyplot as plt
from sklearn.linear_model import LogisticRegression
from sklearn import datasets
from sklearn.inspection import DecisionBoundaryDisplay

# import some data to play with
iris = datasets.load_iris()
X = iris.data[:, :2]  # we only take the first two features.
Y = iris.target

# Create an instance of Logistic Regression Classifier and fit the data.
logreg = LogisticRegression(C=1e5)
logreg.fit(X, Y)

_, ax = plt.subplots(figsize=(4, 3))
DecisionBoundaryDisplay.from_estimator(
    logreg,
    X,
    cmap=plt.cm.Paired,
    ax=ax,
    response_method="predict",
    plot_method="pcolormesh",
    shading="auto",
    xlabel="Sepal length",
    ylabel="Sepal width",
    eps=0.5,
)

# Plot also the training points
plt.scatter(X[:, 0], X[:, 1], c=Y, edgecolors="k", cmap=plt.cm.Paired)


plt.xticks(())
plt.yticks(())

plt.show()
Total running time of the script: ( 0 minutes 0.047 seconds)