sklearn.metrics.det_curve
- sklearn.metrics.det_curve(y_true, y_score, pos_label=None, sample_weight=None)[source]
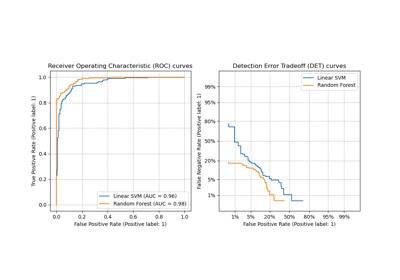
Compute error rates for different probability thresholds.
Note
This metric is used for evaluation of ranking and error tradeoffs of a binary classification task.
Read more in the User Guide.
New in version 0.24.
- Parameters
- y_truendarray of shape (n_samples,)
True binary labels. If labels are not either {-1, 1} or {0, 1}, then pos_label should be explicitly given.
- y_scorendarray of shape of (n_samples,)
Target scores, can either be probability estimates of the positive class, confidence values, or non-thresholded measure of decisions (as returned by “decision_function” on some classifiers).
- pos_labelint or str, default=None
The label of the positive class. When
pos_label=None, ify_trueis in {-1, 1} or {0, 1},pos_labelis set to 1, otherwise an error will be raised.- sample_weightarray-like of shape (n_samples,), default=None
Sample weights.
- Returns
- fprndarray of shape (n_thresholds,)
False positive rate (FPR) such that element i is the false positive rate of predictions with score >= thresholds[i]. This is occasionally referred to as false acceptance propability or fall-out.
- fnrndarray of shape (n_thresholds,)
False negative rate (FNR) such that element i is the false negative rate of predictions with score >= thresholds[i]. This is occasionally referred to as false rejection or miss rate.
- thresholdsndarray of shape (n_thresholds,)
Decreasing score values.
See also
DetCurveDisplay.from_estimatorPlot DET curve given an estimator and some data.
DetCurveDisplay.from_predictionsPlot DET curve given the true and predicted labels.
DetCurveDisplayDET curve visualization.
roc_curveCompute Receiver operating characteristic (ROC) curve.
precision_recall_curveCompute precision-recall curve.
Examples
>>> import numpy as np
>>> from sklearn.metrics import det_curve
>>> y_true = np.array([0, 0, 1, 1])
>>> y_scores = np.array([0.1, 0.4, 0.35, 0.8])
>>> fpr, fnr, thresholds = det_curve(y_true, y_scores)
>>> fpr
array([0.5, 0.5, 0. ])
>>> fnr
array([0. , 0.5, 0.5])
>>> thresholds
array([0.35, 0.4 , 0.8 ])

