sklearn.datasets.load_digits
-
sklearn.datasets.load_digits(*, n_class=10, return_X_y=False, as_frame=False)[source]¶ Load and return the digits dataset (classification).
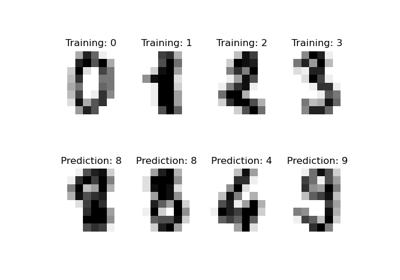
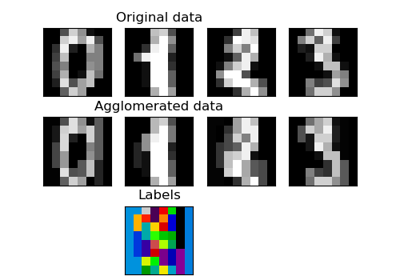
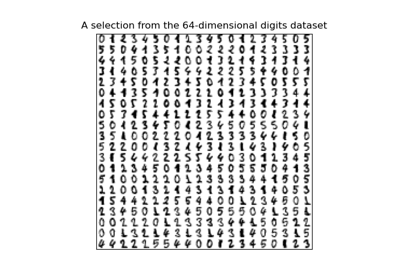
Each datapoint is a 8x8 image of a digit.
Classes
10
Samples per class
~180
Samples total
1797
Dimensionality
64
Features
integers 0-16
Read more in the User Guide.
- Parameters
- n_classinteger, between 0 and 10, optional (default=10)
The number of classes to return.
- return_X_ybool, default=False.
If True, returns
(data, target)instead of a Bunch object. See below for more information about thedataandtargetobject.New in version 0.18.
- as_framebool, default=False
If True, the data is a pandas DataFrame including columns with appropriate dtypes (numeric). The target is a pandas DataFrame or Series depending on the number of target columns. If
return_X_yis True, then (data,target) will be pandas DataFrames or Series as described below.New in version 0.23.
- Returns
- data
Bunch Dictionary-like object, with the following attributes.
- data{ndarray, dataframe} of shape (1797, 64)
The flattened data matrix. If
as_frame=True,datawill be a pandas DataFrame.- target: {ndarray, Series} of shape (1797,)
The classification target. If
as_frame=True,targetwill be a pandas Series.- feature_names: list
The names of the dataset columns.
- target_names: list
The names of target classes.
New in version 0.20.
- frame: DataFrame of shape (1797, 65)
Only present when
as_frame=True. DataFrame withdataandtarget.New in version 0.23.
- images: {ndarray} of shape (1797, 8, 8)
The raw image data.
- DESCR: str
The full description of the dataset.
- (data, target)tuple if
return_X_yis True New in version 0.18.
- This is a copy of the test set of the UCI ML hand-written digits datasets
- https://archive.ics.uci.edu/ml/datasets/Optical+Recognition+of+Handwritten+Digits
- data
Examples
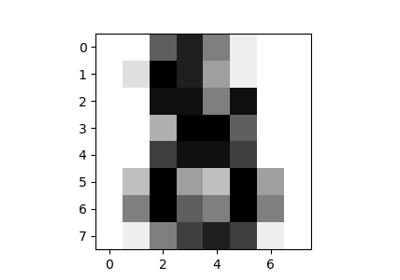
To load the data and visualize the images:
>>> from sklearn.datasets import load_digits
>>> digits = load_digits()
>>> print(digits.data.shape)
(1797, 64)
>>> import matplotlib.pyplot as plt
>>> plt.gray()
>>> plt.matshow(digits.images[0])
>>> plt.show()

