Note
Click here to download the full example code or to run this example in your browser via Binder
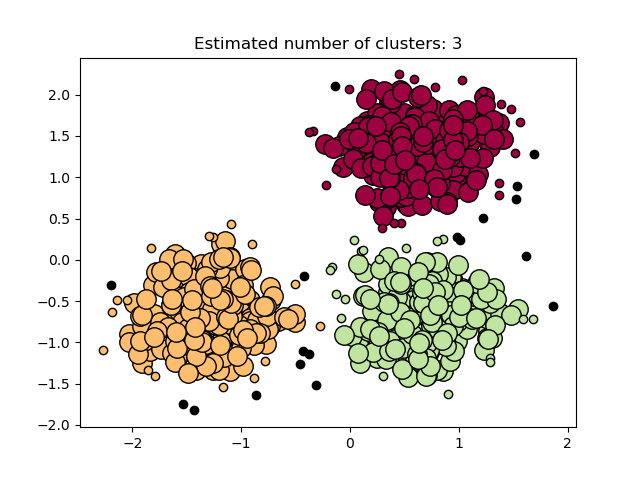
Demo of DBSCAN clustering algorithm
Finds core samples of high density and expands clusters from them.

Out:
Estimated number of clusters: 3
Estimated number of noise points: 18
Homogeneity: 0.953
Completeness: 0.883
V-measure: 0.917
Adjusted Rand Index: 0.952
Adjusted Mutual Information: 0.916
Silhouette Coefficient: 0.626
print(__doc__)

import numpy as np

from sklearn.cluster import DBSCAN
from sklearn import metrics
from sklearn.datasets import make_blobs
from sklearn.preprocessing import StandardScaler


# #############################################################################
# Generate sample data
centers = [[1, 1], [-1, -1], [1, -1]]
X, labels_true = make_blobs(n_samples=750, centers=centers, cluster_std=0.4,
                            random_state=0)

X = StandardScaler().fit_transform(X)

# #############################################################################
# Compute DBSCAN
db = DBSCAN(eps=0.3, min_samples=10).fit(X)
core_samples_mask = np.zeros_like(db.labels_, dtype=bool)
core_samples_mask[db.core_sample_indices_] = True
labels = db.labels_

# Number of clusters in labels, ignoring noise if present.
n_clusters_ = len(set(labels)) - (1 if -1 in labels else 0)
n_noise_ = list(labels).count(-1)

print('Estimated number of clusters: %d' % n_clusters_)
print('Estimated number of noise points: %d' % n_noise_)
print("Homogeneity: %0.3f" % metrics.homogeneity_score(labels_true, labels))
print("Completeness: %0.3f" % metrics.completeness_score(labels_true, labels))
print("V-measure: %0.3f" % metrics.v_measure_score(labels_true, labels))
print("Adjusted Rand Index: %0.3f"
      % metrics.adjusted_rand_score(labels_true, labels))
print("Adjusted Mutual Information: %0.3f"
      % metrics.adjusted_mutual_info_score(labels_true, labels))
print("Silhouette Coefficient: %0.3f"
      % metrics.silhouette_score(X, labels))

# #############################################################################
# Plot result
import matplotlib.pyplot as plt

# Black removed and is used for noise instead.
unique_labels = set(labels)
colors = [plt.cm.Spectral(each)
          for each in np.linspace(0, 1, len(unique_labels))]
for k, col in zip(unique_labels, colors):
    if k == -1:
        # Black used for noise.
        col = [0, 0, 0, 1]

    class_member_mask = (labels == k)

    xy = X[class_member_mask & core_samples_mask]
    plt.plot(xy[:, 0], xy[:, 1], 'o', markerfacecolor=tuple(col),
             markeredgecolor='k', markersize=14)

    xy = X[class_member_mask & ~core_samples_mask]
    plt.plot(xy[:, 0], xy[:, 1], 'o', markerfacecolor=tuple(col),
             markeredgecolor='k', markersize=6)

plt.title('Estimated number of clusters: %d' % n_clusters_)
plt.show()
Total running time of the script: ( 0 minutes 0.146 seconds)
