
Note
Click here to download the full example code
Model Complexity Influence
Demonstrate how model complexity influences both prediction accuracy and computational performance.
The dataset is the Boston Housing dataset (resp. 20 Newsgroups) for regression (resp. classification).
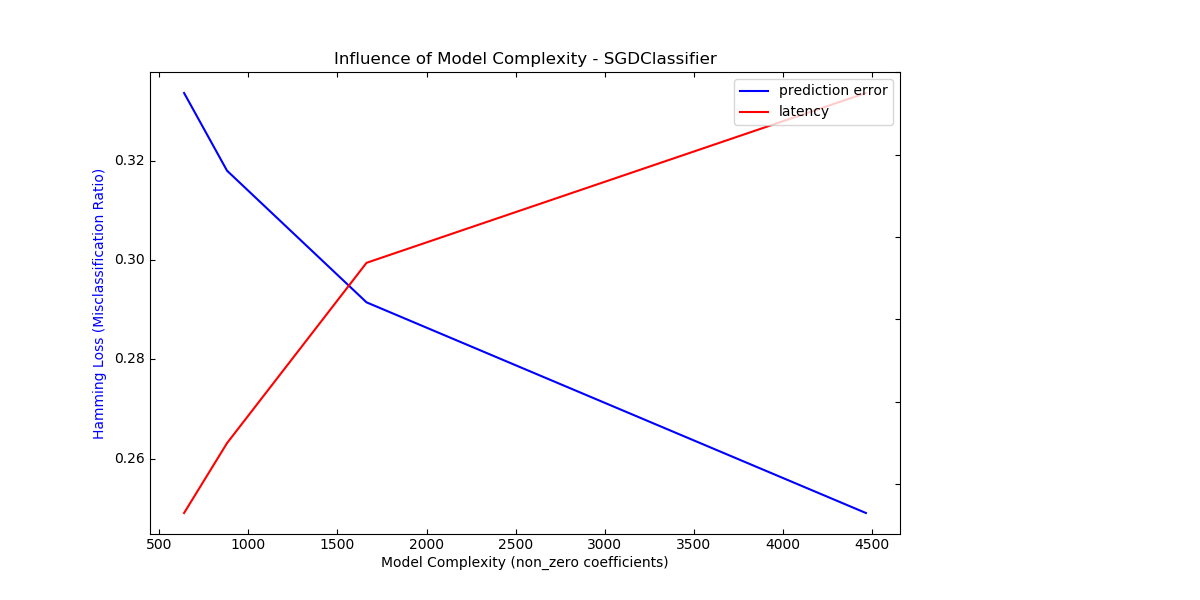
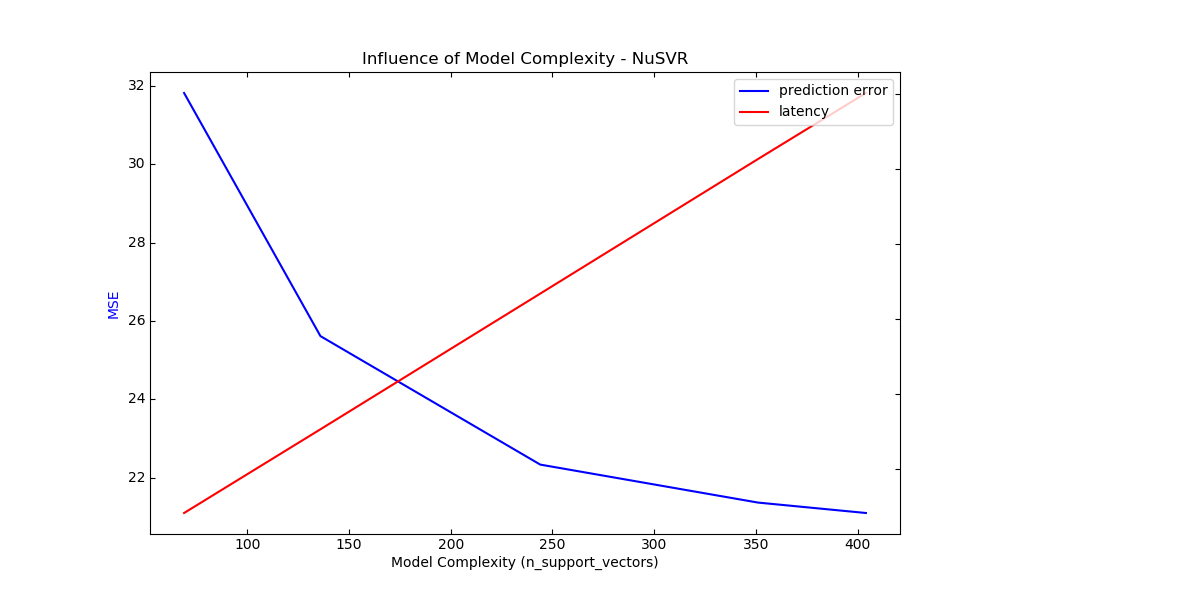
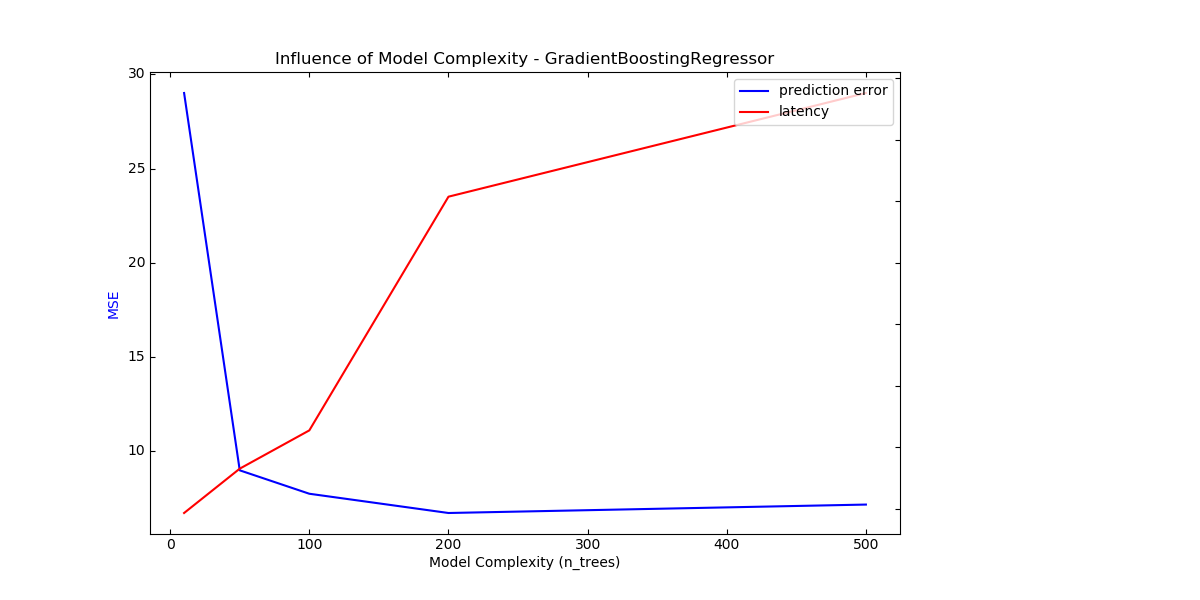
For each class of models we make the model complexity vary through the choice of relevant model parameters and measure the influence on both computational performance (latency) and predictive power (MSE or Hamming Loss).
Out:
Benchmarking SGDClassifier(alpha=0.001, l1_ratio=0.25, loss='modified_huber',
              penalty='elasticnet')
Complexity: 4466 | Hamming Loss (Misclassification Ratio): 0.2491 | Pred. Time: 0.021496s

Benchmarking SGDClassifier(alpha=0.001, l1_ratio=0.5, loss='modified_huber',
              penalty='elasticnet')
Complexity: 1663 | Hamming Loss (Misclassification Ratio): 0.2915 | Pred. Time: 0.017370s

Benchmarking SGDClassifier(alpha=0.001, l1_ratio=0.75, loss='modified_huber',
              penalty='elasticnet')
Complexity: 880 | Hamming Loss (Misclassification Ratio): 0.3180 | Pred. Time: 0.012989s

Benchmarking SGDClassifier(alpha=0.001, l1_ratio=0.9, loss='modified_huber',
              penalty='elasticnet')
Complexity: 639 | Hamming Loss (Misclassification Ratio): 0.3337 | Pred. Time: 0.011292s

Benchmarking NuSVR(C=1000.0, gamma=3.0517578125e-05, nu=0.1)
Complexity: 69 | MSE: 31.8139 | Pred. Time: 0.000283s

Benchmarking NuSVR(C=1000.0, gamma=3.0517578125e-05, nu=0.25)
Complexity: 136 | MSE: 25.6140 | Pred. Time: 0.000506s

Benchmarking NuSVR(C=1000.0, gamma=3.0517578125e-05)
Complexity: 244 | MSE: 22.3375 | Pred. Time: 0.000868s

Benchmarking NuSVR(C=1000.0, gamma=3.0517578125e-05, nu=0.75)
Complexity: 351 | MSE: 21.3688 | Pred. Time: 0.001226s

Benchmarking NuSVR(C=1000.0, gamma=3.0517578125e-05, nu=0.9)
Complexity: 404 | MSE: 21.1033 | Pred. Time: 0.001402s

Benchmarking GradientBoostingRegressor(n_estimators=10)
Complexity: 10 | MSE: 29.0148 | Pred. Time: 0.000093s

Benchmarking GradientBoostingRegressor(n_estimators=50)
Complexity: 50 | MSE: 8.9630 | Pred. Time: 0.000165s

Benchmarking GradientBoostingRegressor()
Complexity: 100 | MSE: 7.7187 | Pred. Time: 0.000227s

Benchmarking GradientBoostingRegressor(n_estimators=200)
Complexity: 200 | MSE: 6.6955 | Pred. Time: 0.000608s

Benchmarking GradientBoostingRegressor(n_estimators=500)
Complexity: 500 | MSE: 7.1437 | Pred. Time: 0.000776s
print(__doc__)

# Author: Eustache Diemert <eustache@diemert.fr>
# License: BSD 3 clause

import time
import numpy as np
import matplotlib.pyplot as plt
from mpl_toolkits.axes_grid1.parasite_axes import host_subplot
from mpl_toolkits.axisartist.axislines import Axes
from scipy.sparse.csr import csr_matrix

from sklearn import datasets
from sklearn.utils import shuffle
from sklearn.metrics import mean_squared_error
from sklearn.svm.classes import NuSVR
from sklearn.ensemble.gradient_boosting import GradientBoostingRegressor
from sklearn.linear_model.stochastic_gradient import SGDClassifier
from sklearn.metrics import hamming_loss

# #############################################################################
# Routines


# Initialize random generator
np.random.seed(0)


def generate_data(case, sparse=False):
    """Generate regression/classification data."""
    bunch = None
    if case == 'regression':
        bunch = datasets.load_boston()
    elif case == 'classification':
        bunch = datasets.fetch_20newsgroups_vectorized(subset='all')
    X, y = shuffle(bunch.data, bunch.target)
    offset = int(X.shape[0] * 0.8)
    X_train, y_train = X[:offset], y[:offset]
    X_test, y_test = X[offset:], y[offset:]
    if sparse:
        X_train = csr_matrix(X_train)
        X_test = csr_matrix(X_test)
    else:
        X_train = np.array(X_train)
        X_test = np.array(X_test)
    y_test = np.array(y_test)
    y_train = np.array(y_train)
    data = {'X_train': X_train, 'X_test': X_test, 'y_train': y_train,
            'y_test': y_test}
    return data


def benchmark_influence(conf):
    """
    Benchmark influence of :changing_param: on both MSE and latency.
    """
    prediction_times = []
    prediction_powers = []
    complexities = []
    for param_value in conf['changing_param_values']:
        conf['tuned_params'][conf['changing_param']] = param_value
        estimator = conf['estimator'](**conf['tuned_params'])
        print("Benchmarking %s" % estimator)
        estimator.fit(conf['data']['X_train'], conf['data']['y_train'])
        conf['postfit_hook'](estimator)
        complexity = conf['complexity_computer'](estimator)
        complexities.append(complexity)
        start_time = time.time()
        for _ in range(conf['n_samples']):
            y_pred = estimator.predict(conf['data']['X_test'])
        elapsed_time = (time.time() - start_time) / float(conf['n_samples'])
        prediction_times.append(elapsed_time)
        pred_score = conf['prediction_performance_computer'](
            conf['data']['y_test'], y_pred)
        prediction_powers.append(pred_score)
        print("Complexity: %d | %s: %.4f | Pred. Time: %fs\n" % (
            complexity, conf['prediction_performance_label'], pred_score,
            elapsed_time))
    return prediction_powers, prediction_times, complexities


def plot_influence(conf, mse_values, prediction_times, complexities):
    """
    Plot influence of model complexity on both accuracy and latency.
    """
    plt.figure(figsize=(12, 6))
    host = host_subplot(111, axes_class=Axes)
    plt.subplots_adjust(right=0.75)
    par1 = host.twinx()
    host.set_xlabel('Model Complexity (%s)' % conf['complexity_label'])
    y1_label = conf['prediction_performance_label']
    y2_label = "Time (s)"
    host.set_ylabel(y1_label)
    par1.set_ylabel(y2_label)
    p1, = host.plot(complexities, mse_values, 'b-', label="prediction error")
    p2, = par1.plot(complexities, prediction_times, 'r-',
                    label="latency")
    host.legend(loc='upper right')
    host.axis["left"].label.set_color(p1.get_color())
    par1.axis["right"].label.set_color(p2.get_color())
    plt.title('Influence of Model Complexity - %s' % conf['estimator'].__name__)
    plt.show()


def _count_nonzero_coefficients(estimator):
    a = estimator.coef_.toarray()
    return np.count_nonzero(a)

# #############################################################################
# Main code
regression_data = generate_data('regression')
classification_data = generate_data('classification', sparse=True)
configurations = [
    {'estimator': SGDClassifier,
     'tuned_params': {'penalty': 'elasticnet', 'alpha': 0.001, 'loss':
                      'modified_huber', 'fit_intercept': True, 'tol': 1e-3},
     'changing_param': 'l1_ratio',
     'changing_param_values': [0.25, 0.5, 0.75, 0.9],
     'complexity_label': 'non_zero coefficients',
     'complexity_computer': _count_nonzero_coefficients,
     'prediction_performance_computer': hamming_loss,
     'prediction_performance_label': 'Hamming Loss (Misclassification Ratio)',
     'postfit_hook': lambda x: x.sparsify(),
     'data': classification_data,
     'n_samples': 30},
    {'estimator': NuSVR,
     'tuned_params': {'C': 1e3, 'gamma': 2 ** -15},
     'changing_param': 'nu',
     'changing_param_values': [0.1, 0.25, 0.5, 0.75, 0.9],
     'complexity_label': 'n_support_vectors',
     'complexity_computer': lambda x: len(x.support_vectors_),
     'data': regression_data,
     'postfit_hook': lambda x: x,
     'prediction_performance_computer': mean_squared_error,
     'prediction_performance_label': 'MSE',
     'n_samples': 30},
    {'estimator': GradientBoostingRegressor,
     'tuned_params': {'loss': 'ls'},
     'changing_param': 'n_estimators',
     'changing_param_values': [10, 50, 100, 200, 500],
     'complexity_label': 'n_trees',
     'complexity_computer': lambda x: x.n_estimators,
     'data': regression_data,
     'postfit_hook': lambda x: x,
     'prediction_performance_computer': mean_squared_error,
     'prediction_performance_label': 'MSE',
     'n_samples': 30},
]
for conf in configurations:
    prediction_performances, prediction_times, complexities = \
        benchmark_influence(conf)
    plot_influence(conf, prediction_performances, prediction_times,
                   complexities)
Total running time of the script: ( 0 minutes 35.625 seconds)