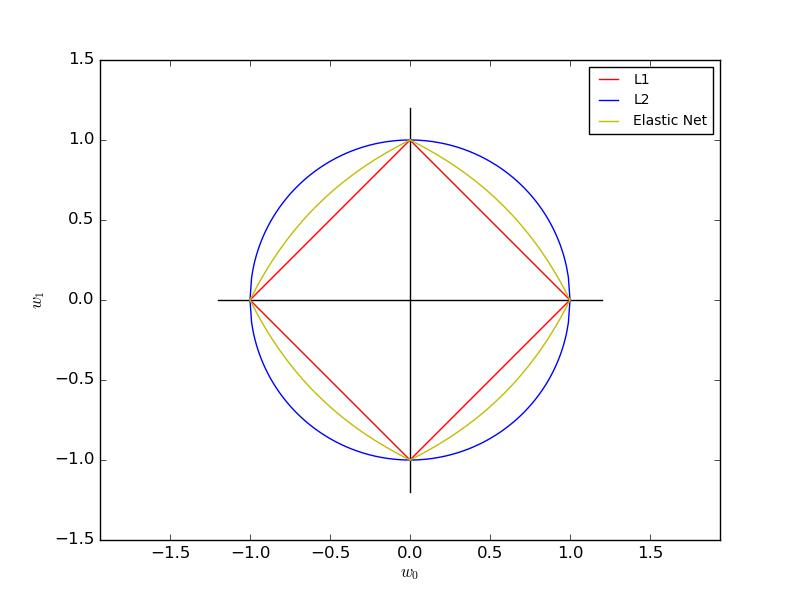
SGD: Penalties
Plot the contours of the three penalties.
All of the above are supported by
sklearn.linear_model.stochastic_gradient.

Python source code: plot_sgd_penalties.py
from __future__ import division
print(__doc__)

import numpy as np
import matplotlib.pyplot as plt


def l1(xs):
    return np.array([np.sqrt((1 - np.sqrt(x ** 2.0)) ** 2.0) for x in xs])


def l2(xs):
    return np.array([np.sqrt(1.0 - x ** 2.0) for x in xs])


def el(xs, z):
    return np.array([(2 - 2 * x - 2 * z + 4 * x * z -
                      (4 * z ** 2
                       - 8 * x * z ** 2
                       + 8 * x ** 2 * z ** 2
                       - 16 * x ** 2 * z ** 3
                       + 8 * x * z ** 3 + 4 * x ** 2 * z ** 4) ** (1. / 2)
                      - 2 * x * z ** 2) / (2 - 4 * z) for x in xs])


def cross(ext):
    plt.plot([-ext, ext], [0, 0], "k-")
    plt.plot([0, 0], [-ext, ext], "k-")

xs = np.linspace(0, 1, 100)

alpha = 0.501  # 0.5 division throuh zero

cross(1.2)

plt.plot(xs, l1(xs), "r-", label="L1")
plt.plot(xs, -1.0 * l1(xs), "r-")
plt.plot(-1 * xs, l1(xs), "r-")
plt.plot(-1 * xs, -1.0 * l1(xs), "r-")

plt.plot(xs, l2(xs), "b-", label="L2")
plt.plot(xs, -1.0 * l2(xs), "b-")
plt.plot(-1 * xs, l2(xs), "b-")
plt.plot(-1 * xs, -1.0 * l2(xs), "b-")

plt.plot(xs, el(xs, alpha), "y-", label="Elastic Net")
plt.plot(xs, -1.0 * el(xs, alpha), "y-")
plt.plot(-1 * xs, el(xs, alpha), "y-")
plt.plot(-1 * xs, -1.0 * el(xs, alpha), "y-")

plt.xlabel(r"$w_0$")
plt.ylabel(r"$w_1$")
plt.legend()

plt.axis("equal")
plt.show()
Total running time of the example: 0.09 seconds ( 0 minutes 0.09 seconds)

