
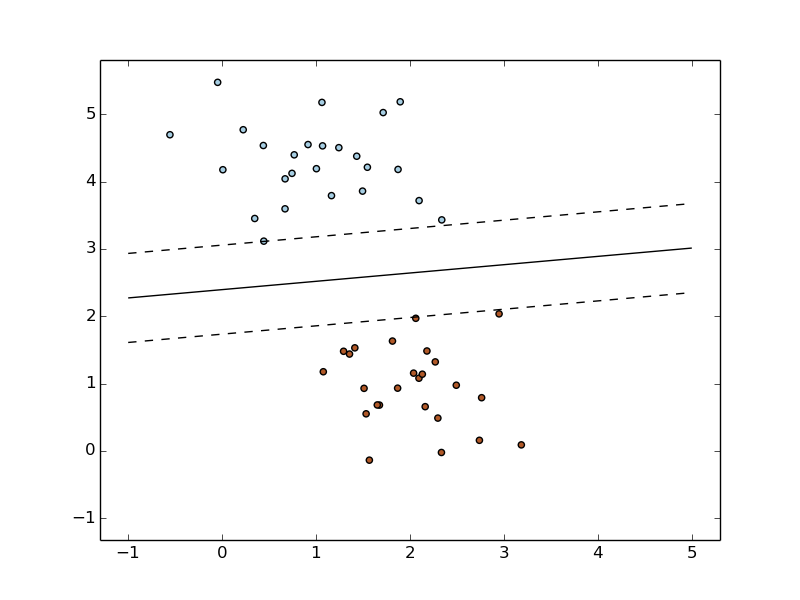
SGD: Maximum margin separating hyperplane
Plot the maximum margin separating hyperplane within a two-class separable dataset using a linear Support Vector Machines classifier trained using SGD.
Python source code: plot_sgd_separating_hyperplane.py
print(__doc__)

import numpy as np
import matplotlib.pyplot as plt
from sklearn.linear_model import SGDClassifier
from sklearn.datasets.samples_generator import make_blobs

# we create 50 separable points
X, Y = make_blobs(n_samples=50, centers=2, random_state=0, cluster_std=0.60)

# fit the model
clf = SGDClassifier(loss="hinge", alpha=0.01, n_iter=200, fit_intercept=True)
clf.fit(X, Y)

# plot the line, the points, and the nearest vectors to the plane
xx = np.linspace(-1, 5, 10)
yy = np.linspace(-1, 5, 10)

X1, X2 = np.meshgrid(xx, yy)
Z = np.empty(X1.shape)
for (i, j), val in np.ndenumerate(X1):
    x1 = val
    x2 = X2[i, j]
    p = clf.decision_function([x1, x2])
    Z[i, j] = p[0]
levels = [-1.0, 0.0, 1.0]
linestyles = ['dashed', 'solid', 'dashed']
colors = 'k'
plt.contour(X1, X2, Z, levels, colors=colors, linestyles=linestyles)
plt.scatter(X[:, 0], X[:, 1], c=Y, cmap=plt.cm.Paired)

plt.axis('tight')
plt.show()
Total running time of the example: 0.09 seconds ( 0 minutes 0.09 seconds)