
Compare BIRCH and MiniBatchKMeans
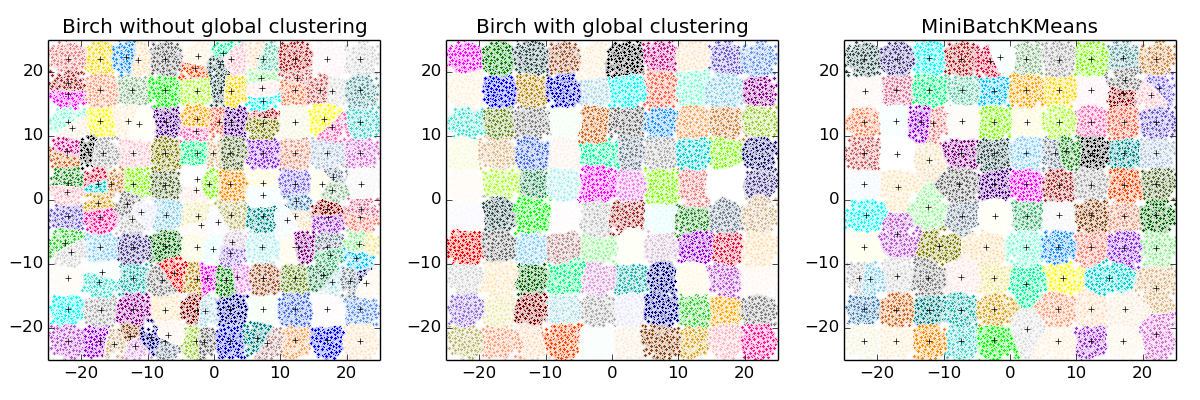
This example compares the timing of Birch (with and without the global clustering step) and MiniBatchKMeans on a synthetic dataset having 100,000 samples and 2 features generated using make_blobs.
If n_clusters is set to None, the data is reduced from 100,000 samples to a set of 158 clusters. This can be viewed as a preprocessing step before the final (global) clustering step that further reduces these 158 clusters to 100 clusters.
Script output:
Birch without global clustering as the final step took 4.19 seconds
n_clusters : 158
Birch with global clustering as the final step took 4.61 seconds
n_clusters : 100
Time taken to run MiniBatchKMeans 5.61 seconds
Python source code: plot_birch_vs_minibatchkmeans.py
# Authors: Manoj Kumar <manojkumarsivaraj334@gmail.com
#          Alexandre Gramfort <alexandre.gramfort@telecom-paristech.fr>
# License: BSD 3 clause

print(__doc__)

from itertools import cycle
from time import time
import numpy as np
import matplotlib.pyplot as plt
import matplotlib.colors as colors

from sklearn.preprocessing import StandardScaler
from sklearn.cluster import Birch, MiniBatchKMeans
from sklearn.datasets.samples_generator import make_blobs


# Generate centers for the blobs so that it forms a 10 X 10 grid.
xx = np.linspace(-22, 22, 10)
yy = np.linspace(-22, 22, 10)
xx, yy = np.meshgrid(xx, yy)
n_centres = np.hstack((np.ravel(xx)[:, np.newaxis],
                       np.ravel(yy)[:, np.newaxis]))

# Generate blobs to do a comparison between MiniBatchKMeans and Birch.
X, y = make_blobs(n_samples=100000, centers=n_centres, random_state=0)


# Use all colors that matplotlib provides by default.
colors_ = cycle(colors.cnames.keys())

fig = plt.figure(figsize=(12, 4))
fig.subplots_adjust(left=0.04, right=0.98, bottom=0.1, top=0.9)

# Compute clustering with Birch with and without the final clustering step
# and plot.
birch_models = [Birch(threshold=1.7, n_clusters=None),
                Birch(threshold=1.7, n_clusters=100)]
final_step = ['without global clustering', 'with global clustering']

for ind, (birch_model, info) in enumerate(zip(birch_models, final_step)):
    t = time()
    birch_model.fit(X)
    time_ = time() - t
    print("Birch %s as the final step took %0.2f seconds" % (
          info, (time() - t)))

    # Plot result
    labels = birch_model.labels_
    centroids = birch_model.subcluster_centers_
    n_clusters = np.unique(labels).size
    print("n_clusters : %d" % n_clusters)

    ax = fig.add_subplot(1, 3, ind + 1)
    for this_centroid, k, col in zip(centroids, range(n_clusters), colors_):
        mask = labels == k
        ax.plot(X[mask, 0], X[mask, 1], 'w',
                markerfacecolor=col, marker='.')
        if birch_model.n_clusters is None:
            ax.plot(this_centroid[0], this_centroid[1], '+', markerfacecolor=col,
                    markeredgecolor='k', markersize=5)
    ax.set_ylim([-25, 25])
    ax.set_xlim([-25, 25])
    ax.set_autoscaley_on(False)
    ax.set_title('Birch %s' % info)

# Compute clustering with MiniBatchKMeans.
mbk = MiniBatchKMeans(init='k-means++', n_clusters=100, batch_size=100,
                      n_init=10, max_no_improvement=10, verbose=0,
                      random_state=0)
t0 = time()
mbk.fit(X)
t_mini_batch = time() - t0
print("Time taken to run MiniBatchKMeans %0.2f seconds" % t_mini_batch)
mbk_means_labels_unique = np.unique(mbk.labels_)

ax = fig.add_subplot(1, 3, 3)
for this_centroid, k, col in zip(mbk.cluster_centers_,
                                 range(n_clusters), colors_):
    mask = mbk.labels_ == k
    ax.plot(X[mask, 0], X[mask, 1], 'w', markerfacecolor=col, marker='.')
    ax.plot(this_centroid[0], this_centroid[1], '+', markeredgecolor='k',
            markersize=5)
ax.set_xlim([-25, 25])
ax.set_ylim([-25, 25])
ax.set_title("MiniBatchKMeans")
ax.set_autoscaley_on(False)
plt.show()
Total running time of the example: 15.69 seconds ( 0 minutes 15.69 seconds)