
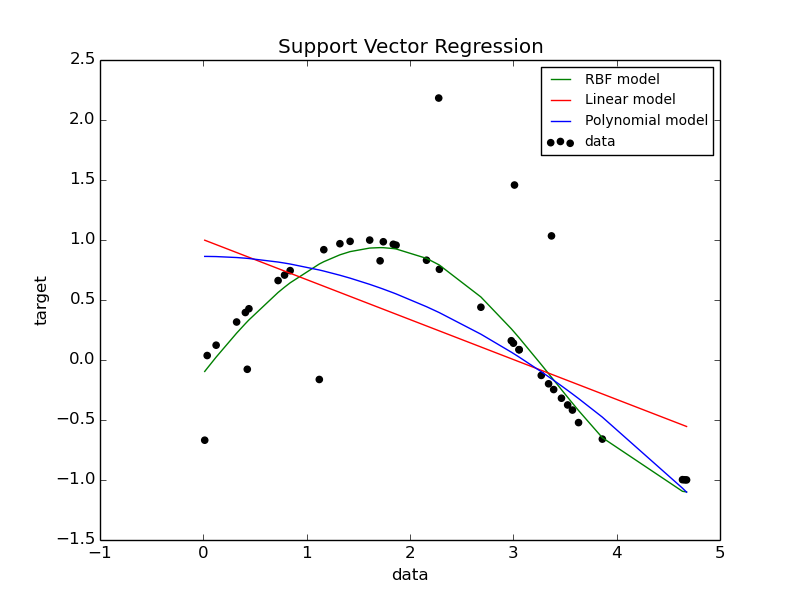
Support Vector Regression (SVR) using linear and non-linear kernels
Toy example of 1D regression using linear, polynomial and RBF kernels.
Python source code: plot_svm_regression.py
print(__doc__)

import numpy as np
from sklearn.svm import SVR
import matplotlib.pyplot as plt

###############################################################################
# Generate sample data
X = np.sort(5 * np.random.rand(40, 1), axis=0)
y = np.sin(X).ravel()

###############################################################################
# Add noise to targets
y[::5] += 3 * (0.5 - np.random.rand(8))

###############################################################################
# Fit regression model
svr_rbf = SVR(kernel='rbf', C=1e3, gamma=0.1)
svr_lin = SVR(kernel='linear', C=1e3)
svr_poly = SVR(kernel='poly', C=1e3, degree=2)
y_rbf = svr_rbf.fit(X, y).predict(X)
y_lin = svr_lin.fit(X, y).predict(X)
y_poly = svr_poly.fit(X, y).predict(X)

###############################################################################
# look at the results
plt.scatter(X, y, c='k', label='data')
plt.hold('on')
plt.plot(X, y_rbf, c='g', label='RBF model')
plt.plot(X, y_lin, c='r', label='Linear model')
plt.plot(X, y_poly, c='b', label='Polynomial model')
plt.xlabel('data')
plt.ylabel('target')
plt.title('Support Vector Regression')
plt.legend()
plt.show()
Total running time of the example: 1.24 seconds ( 0 minutes 1.24 seconds)